Fig. 1
Download original image
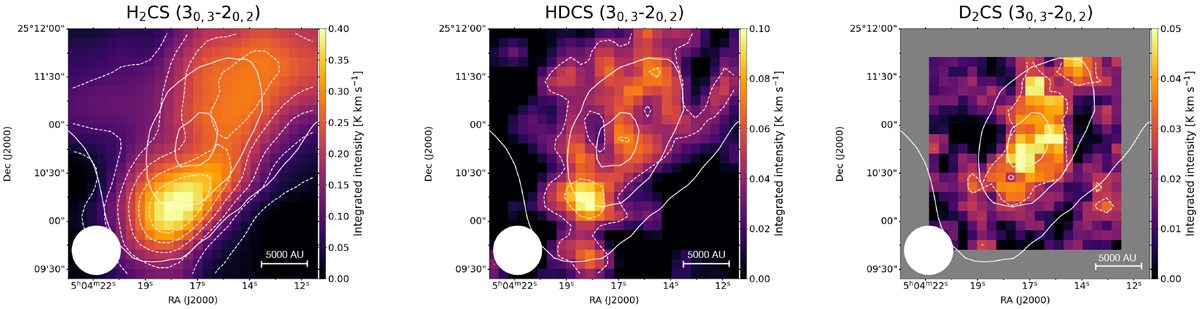
Integrated intensity maps of the 30,з–20,2 transitions of H2CS, HDCS, and D2CS towards the inner 2.5′ × 2.5′ of L1544. All maps have been smoothed to 30.5″, and the beam is shown at the bottom left of each map. The solid white contours are the 30%, 60%, and 90% of the peak intensity of the N(H2) map of L1544 computed from Herschel/SPIRE data (Spezzano et al. 2016). The dashed white contours indicate the 3σ integrated emission with steps of 3σ (![]() , rmsHDCS = 12 mK kms−1,
, rmsHDCS = 12 mK kms−1, ![]() ).
).
Current usage metrics show cumulative count of Article Views (full-text article views including HTML views, PDF and ePub downloads, according to the available data) and Abstracts Views on Vision4Press platform.
Data correspond to usage on the plateform after 2015. The current usage metrics is available 48-96 hours after online publication and is updated daily on week days.
Initial download of the metrics may take a while.