Open Access
Fig. A.1
Download original image
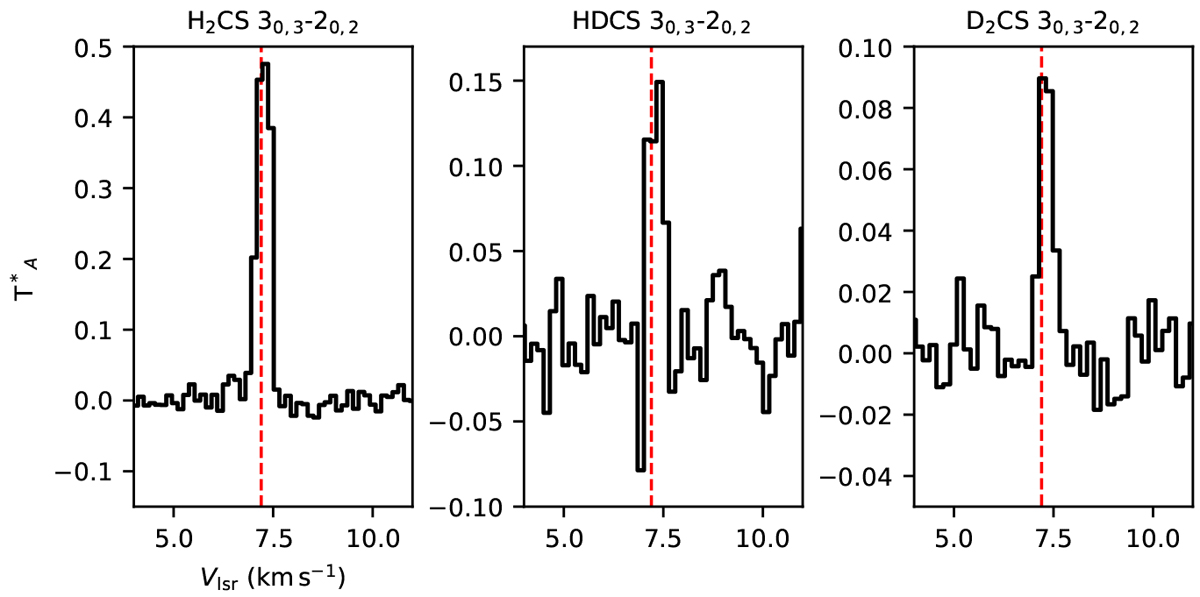
Spectra of the 30,3–20,2 transition of H2CS, HDCS, and D2CS extracted towards the dust peak of L1544. The vertical dashed red line shows the vLSR of the source: 7.2 km/s.
Current usage metrics show cumulative count of Article Views (full-text article views including HTML views, PDF and ePub downloads, according to the available data) and Abstracts Views on Vision4Press platform.
Data correspond to usage on the plateform after 2015. The current usage metrics is available 48-96 hours after online publication and is updated daily on week days.
Initial download of the metrics may take a while.