Fig. 4
Download original image
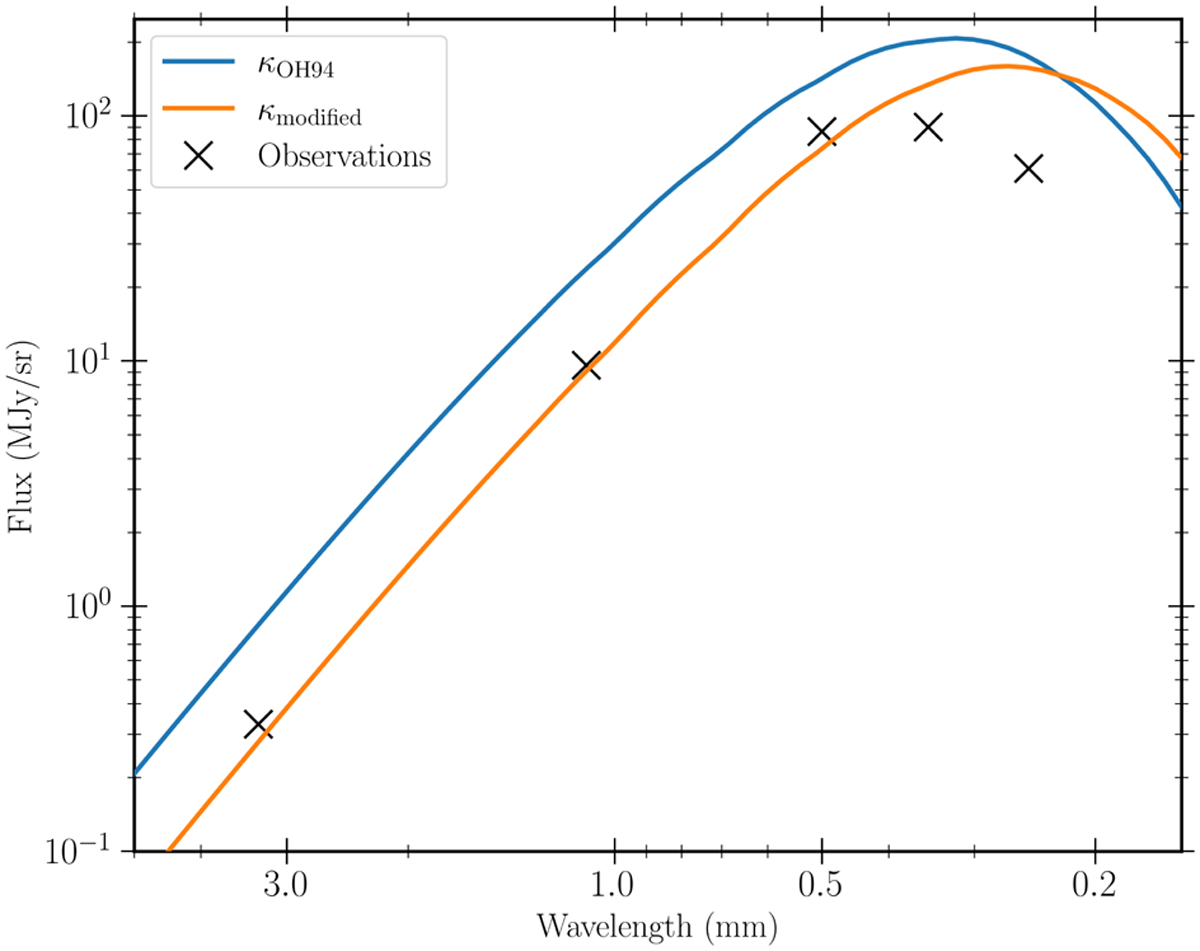
Comparison between the spectral energy distribution of the modeled core and L1544. The observed values for L1544 are indicated with black crosses and are taken from the work by Chacón-Tanarro et al. (2017). The blue line shows the SED for the core model computed using the standard OH94 dust opacities, while the orange line shows the SED when the dust opacities have been multiplied by a factor of 0.2 to match the continuum emission at 1.1 mm.
Current usage metrics show cumulative count of Article Views (full-text article views including HTML views, PDF and ePub downloads, according to the available data) and Abstracts Views on Vision4Press platform.
Data correspond to usage on the plateform after 2015. The current usage metrics is available 48-96 hours after online publication and is updated daily on week days.
Initial download of the metrics may take a while.