Fig. 9
Download original image
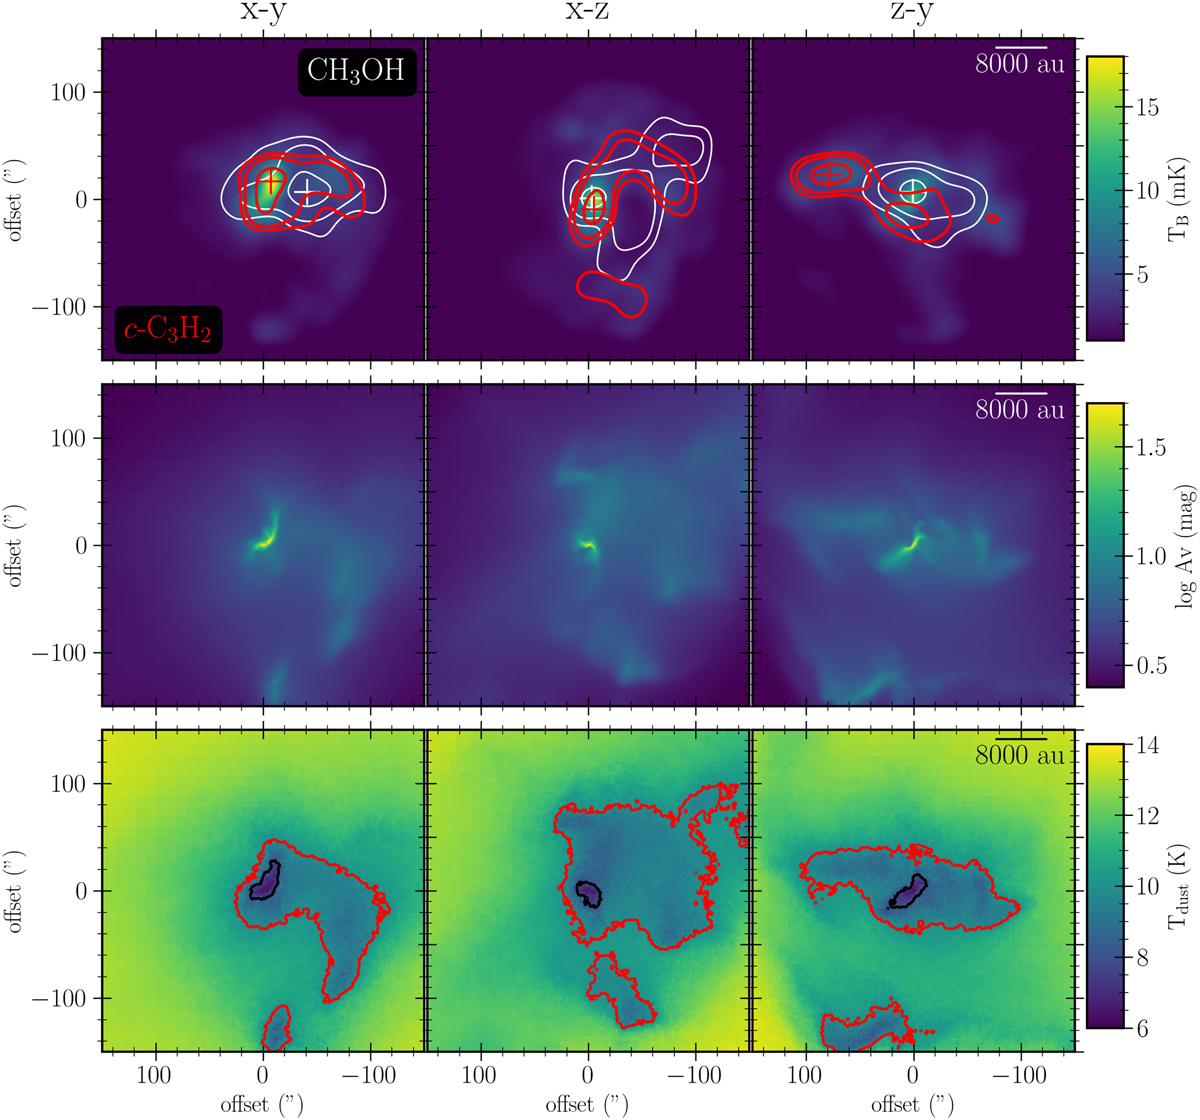
Synthetic imaging and physical maps of the simulated core. Top: comparison between the location and spatial extent of the c-C3H2 32,2− 31,3 transition (red contours) and CH3OH 21,2−11,1 transition (white contours) emission viewed from three different directions in the simulation. Contours show 60, 70, 80, and 90% of the peak emission in the moment-zero maps for each transition. The continuum emission at 1.1 mm is shown by the color map. Middle: logarithm of the computed visual extinction in three planes of the core. A logarithmic scaling is applied to emphasize the variation across the core. A lower limit of Av = 2 mag is applied. Bottom: computed dust temperature in three planes of the core. The black and red contours indicate the 8 and 10 K temperature limits, respectively. A lower limit of 6 K is applied.
Current usage metrics show cumulative count of Article Views (full-text article views including HTML views, PDF and ePub downloads, according to the available data) and Abstracts Views on Vision4Press platform.
Data correspond to usage on the plateform after 2015. The current usage metrics is available 48-96 hours after online publication and is updated daily on week days.
Initial download of the metrics may take a while.