Open Access
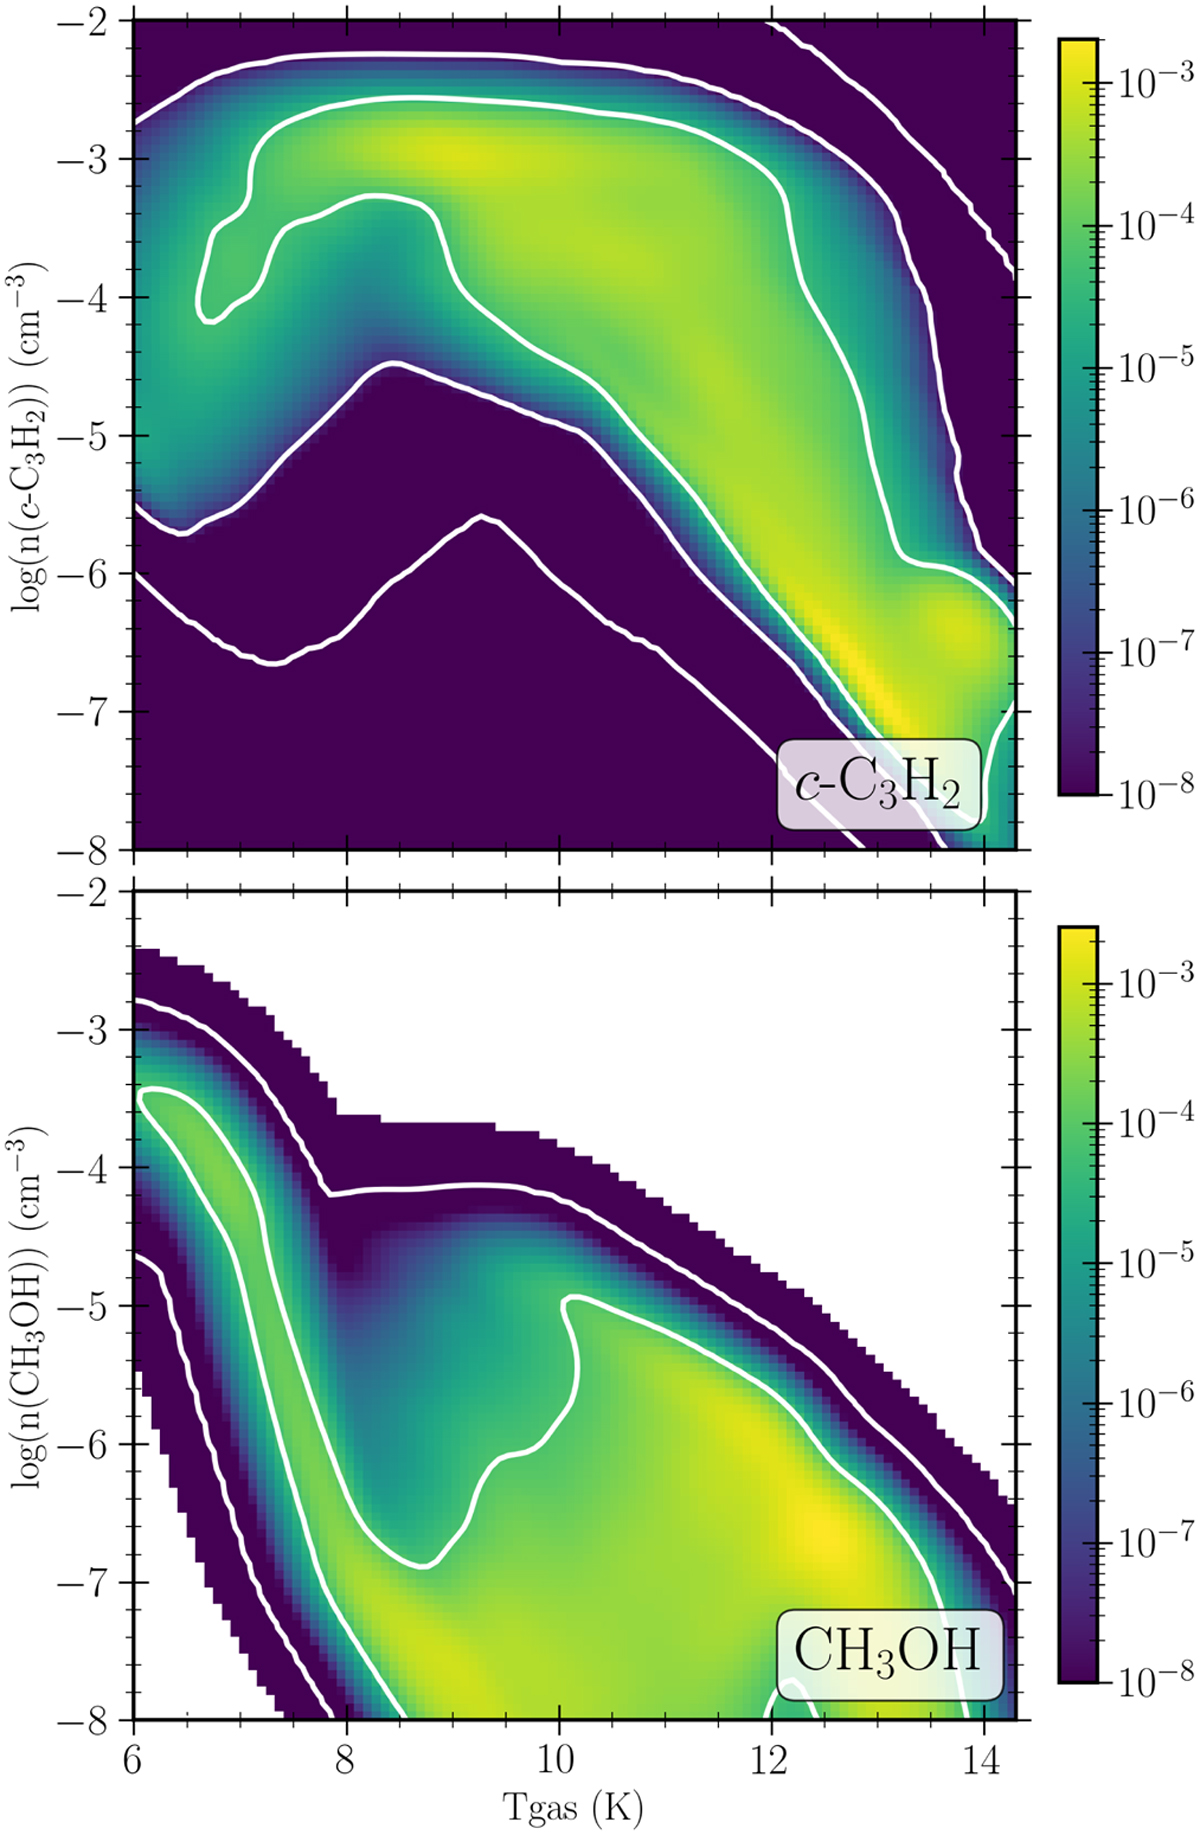
Fig. D.3
Download original image
Gaussian KDE for the absolute chemical abundances as a function of temperature for each cell in the 3D model. Contours show the 25th, 50th, and 75th percentiles. Top panel shows c-C3H2 and bottom panel shows CH3OH. For CH3OH, the 25th percentile is not visible is it is below the limit of the colorbar.
Current usage metrics show cumulative count of Article Views (full-text article views including HTML views, PDF and ePub downloads, according to the available data) and Abstracts Views on Vision4Press platform.
Data correspond to usage on the plateform after 2015. The current usage metrics is available 48-96 hours after online publication and is updated daily on week days.
Initial download of the metrics may take a while.