Open Access
Fig. 7
Download original image
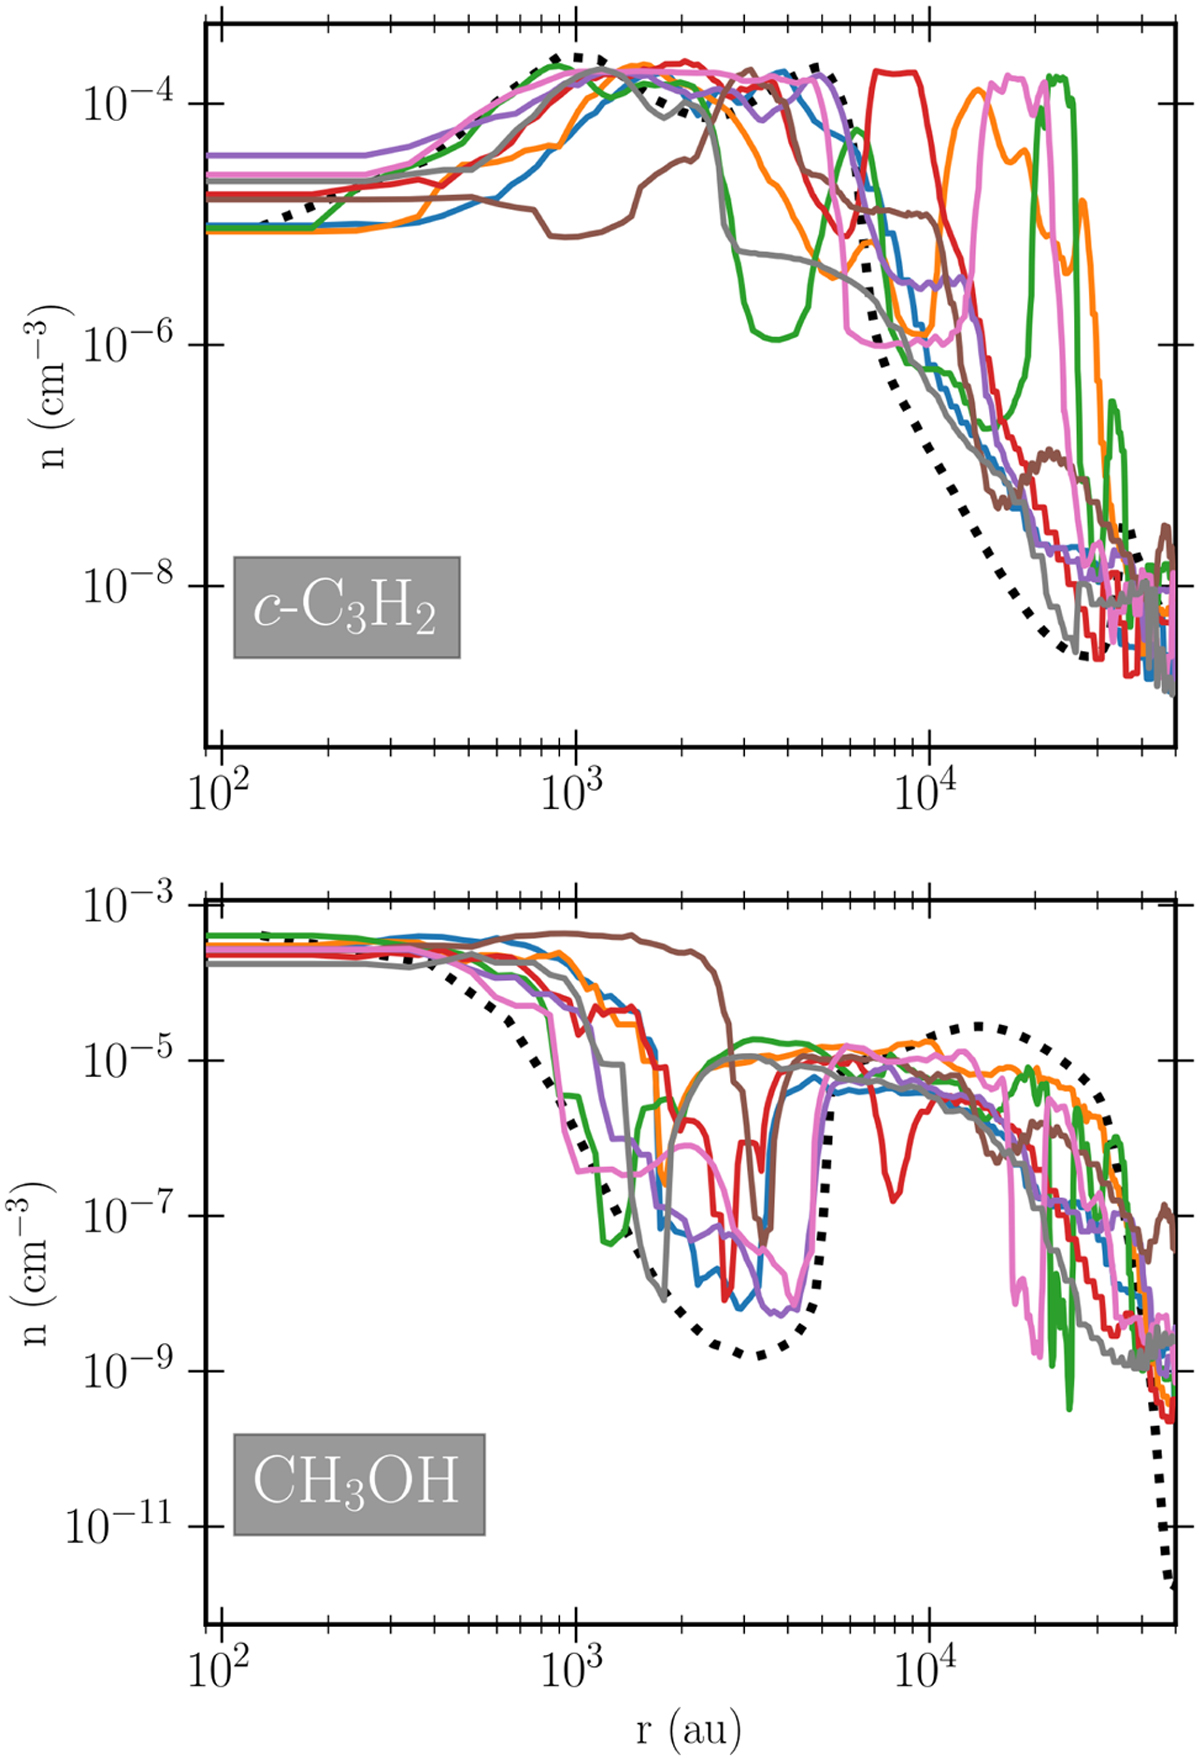
Radial abundance profiles for c-C3 H2 (top) and CH3 OH (bottom) along the eight different profiles matching the colors shown in Fig. 5. The profiles for the 1D hydrodynamical model from Keto & Caselli (2010) is indicated by the black dotted line.
Current usage metrics show cumulative count of Article Views (full-text article views including HTML views, PDF and ePub downloads, according to the available data) and Abstracts Views on Vision4Press platform.
Data correspond to usage on the plateform after 2015. The current usage metrics is available 48-96 hours after online publication and is updated daily on week days.
Initial download of the metrics may take a while.