Fig. C.1
Download original image
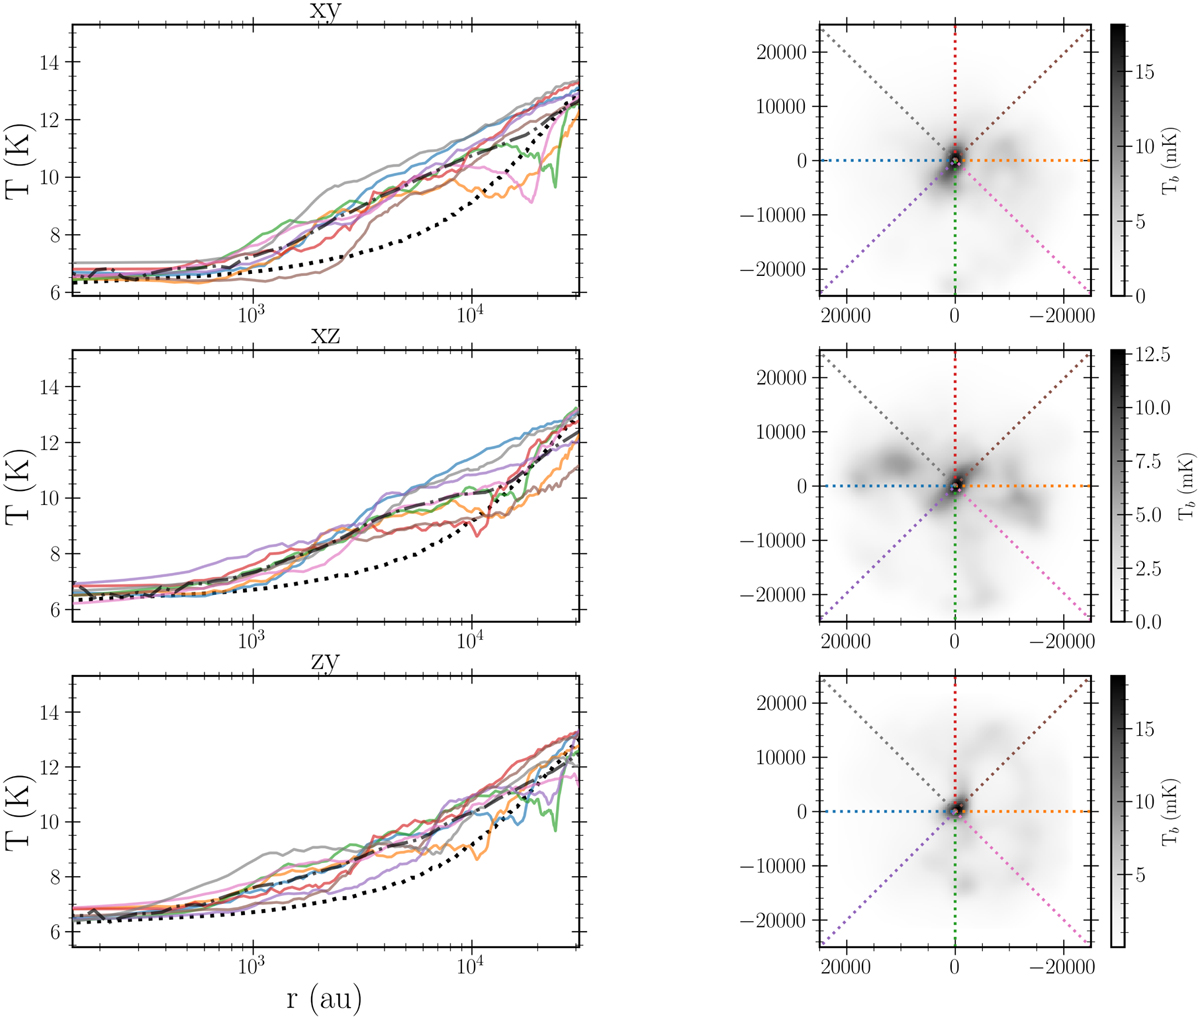
Thermal structure of the simulated core. Left: Radial profiles for the dust temperature along 8 different radial cuts on the x-y, z-x, and z-y planes. The profiles for the 1D hydrodynamical model from Keto & Caselli (2010) is indicated by the black dotted line. Right: Greyscale images shows the continuum emission of the core at 1.1 mm, while contours indicate 15%, 30%, 45%, 60%, and 75 % of the peak intensity. The dotted colored lines indicate the direction along which the radial profiles in the other panel were extracted.
Current usage metrics show cumulative count of Article Views (full-text article views including HTML views, PDF and ePub downloads, according to the available data) and Abstracts Views on Vision4Press platform.
Data correspond to usage on the plateform after 2015. The current usage metrics is available 48-96 hours after online publication and is updated daily on week days.
Initial download of the metrics may take a while.