Open Access
Fig. A.1
Download original image
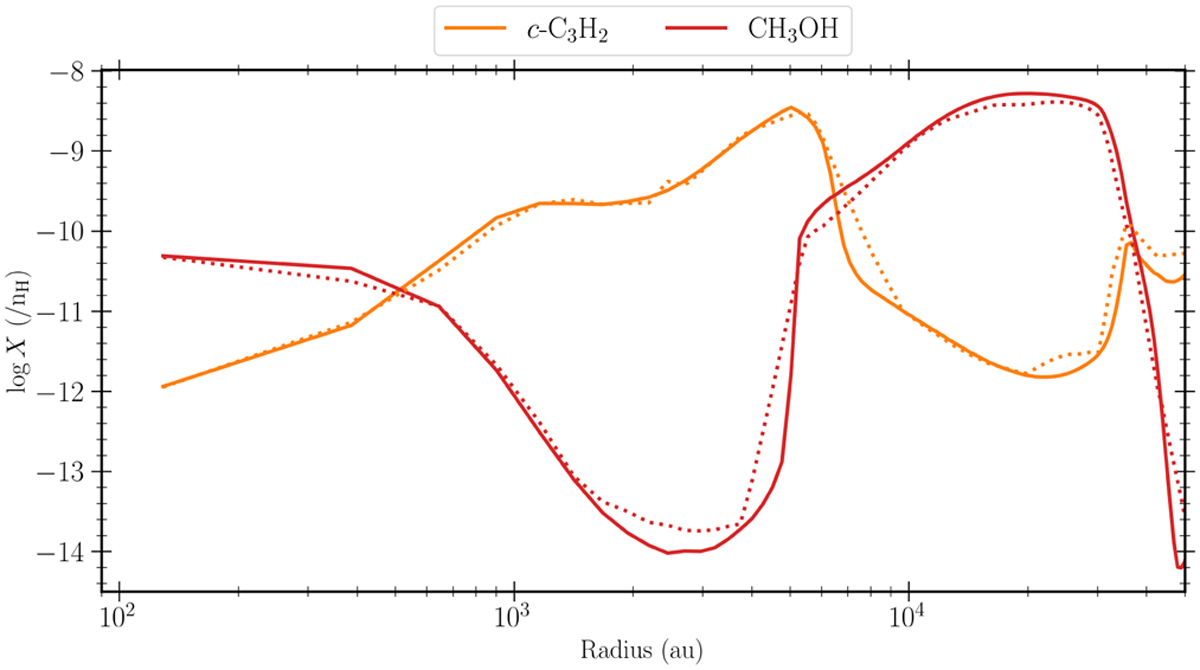
Comparison between the radial chemical profiles when computing the chemical abundances directly on the 1D model grid (solid lines) and when using the interpolation module (dotted lines) for CH3 OH and c-C3H2.
Current usage metrics show cumulative count of Article Views (full-text article views including HTML views, PDF and ePub downloads, according to the available data) and Abstracts Views on Vision4Press platform.
Data correspond to usage on the plateform after 2015. The current usage metrics is available 48-96 hours after online publication and is updated daily on week days.
Initial download of the metrics may take a while.