| Issue |
A&A
Volume 669, January 2023
|
|
|---|---|---|
| Article Number | A126 | |
| Number of page(s) | 29 | |
| Section | Planets and planetary systems | |
| DOI | https://doi.org/10.1051/0004-6361/202244428 | |
| Published online | 24 January 2023 | |
Directly tracing the vertical stratification of molecules in protoplanetary disks
1
European Southern Observatory,
Karl-Schwarzschild-Str 2,
85748
Garching, Germany
e-mail: tpaneque@eso.org
2
Leiden Observatory, Leiden University,
PO Box 9513,
2300 RA
Leiden, The Netherlands
3
Max-Planck-Institut für extraterrestrische Physik,
Gießenbachstr. 1,
85748
Garching bei München, Germany
4
Université Paris-Saclay, CNRS, Institut d’Astrophysique Spatiale,
91405
Orsay, France
5
Dipartimento di Fisica, Università degli Studi di Milano,
Via Celoria, 16,
Milano
20133,
Italy
Received:
6
July
2022
Accepted:
1
October
2022
Context. The specific location from where molecules emit in a protoplanetary disk depends on the system properties. Therefore, directly constraining the emitting regions radially, azimuthally, and vertically is key to studying the environment of planet formation. Due to the difficulties and lack of high resolution observations, most of the current observational constraints for the vertical distribution of molecular emission rely on indirect methods.
Aims. We aim to directly trace the vertical location of the emitting surface of multiple molecular tracers in protoplanetary disks. Our sample of disks includes Elias 2-27, WaOph 6, and the sources targeted by the MAPS ALMA Large Program. The set of molecules studied includes CO isotopologues in various transitions, HCN, CN, H2CO, HCO+, C2H, and c-C3H2.
Methods. The vertical emitting region is determined directly from the channel maps by tracing the location of emission maxima along the upper surface. This method has been used in previous studies, but here we implement an accurate masking of the channel emission in order to recover the vertical location of the emission surface even at large radial distances from the star and for low-S/N lines. Parametric models are used to describe the emission surfaces and characterize any structure within the vertical profile.
Results. The vertical location of the emitting layer is obtained for ten different molecules and transitions in HD 163296. In the rest of the sample it is possible to vertically locate between four and seven lines. Brightness temperature profiles are obtained for the entire sample and for all CO isotopologues. IM Lup, HD 163296, and MWC 480 12CO and 13CO show vertical modulations, which are characterized and found to be coincident with dust gaps and kinematical perturbations. We also present estimates of the gas pressure scale height in the disks from the MAPS sample. Compared to physical-chemical models, we find good agreement with the vertical location of CO isotopologues. In HD 163296, CN and HCN trace a similar intermediate layer, which is expected from physical-chemical models. For the other disks, we find that UV flux tracers and the vertical profiles of HCN and C2H are lower than predicted in theoretical models. HCN and H2CO show a highly structured vertical profile, possibly indicative of different formation pathways in the case of H2CO.
Conclusions. It is possible to trace the vertical locations of multiple molecular species that in turn trace a wide variety of physical and chemical disk properties. The distribution of CO isotopologues is in agreement with theoretical predictions, and the emission is found at a wide range of vertical heights, z/r = 0.5–0.05. The vertical location of CO may be inversely related to the stellar mass. Other molecular lines are mostly found at z/r ≤ 0.15. The vertical layering of molecules is in agreement with theoretical predictions in some systems, but not in all. Therefore, dedicated physical-chemical models are needed to further study and understand the diversity of the emission surfaces.
Key words: astrochemistry / protoplanetary disks
© The Authors 2023
 Open Access article, published by EDP Sciences, under the terms of the Creative Commons Attribution License (https://creativecommons.org/licenses/by/4.0), which permits unrestricted use, distribution, and reproduction in any medium, provided the original work is properly cited.
This article is published in open access under the Subscribe-to-Open model. Subscribe to A&A to support open access publication.
1 Introduction
Planets form in disks of dust and gas that surround young stars. In recent years the spatial resolution and sensitivity achieved by instruments such as the Atacama Large Millimeter/submillimeter Array (ALMA) has allowed us to characterize these objects in detail. A key feature that we can only now properly study is the disk vertical structure, if data at an adequate resolution are available. Protoplanetary disks have a vertical extent that depends on the system properties, such as the stellar mass and radiation field, but also on the disk temperature structure and surface density distribution (Bell et al. 1997; D’Alessio et al. 1998; Aikawa & Herbst 1999; van Zadelhoff et al. 2001; Walsh et al. 2010; Fogel et al. 2011; Rosenfeld et al. 2013). The vertical extent of a disk is set by hydrostatic equilibrium: the balance between stellar gravity and pressure support (Armitage 2015). Tracing of the vertical structure can be used to detect deviations from equilibrium that can be related to meridional flows in the presence of planets (Morbidelli et al. 2014; Szulágyi et al. 2022), shadowing due to warped structures (Nealon et al. 2019), or infall of material (Hennebelle et al. 2017), among other factors. While larger, millimetre-sized, grains are expected to be settled in the midplane of disks, molecular and scattered light observations can be used to recover the vertical structure of the disk (e.g. Pinte et al. 2018a; Avenhaus et al. 2018; Villenave et al. 2020; Law et al. 2021b).
Studying the vertical location of various molecular tracers is particularly powerful for accurately mapping the disk structure thanks to the sensitivity of line emission to temperature, radiation, and density variations. Several works have used the excitation temperature of line emission to infer the expected vertical location of a given molecule (e.g. van Zadelhoff et al. 2001; Dartois et al. 2003; Teague & Loomis 2020; Bergner et al. 2021; Ilee et al. 2021). This indirect approach is promising, but it relies on physical-chemical models and assumptions about the disk conditions at the location of the emission. Direct tracing of molecular emission layers is fundamental for comparisons with current models. Previous studies have focused on edge-on disks to do this (e.g. Podio et al. 2020; van’t Hoff et al. 2020; Villenave et al. 2020; Ruíz-Rodríguez et al. 2021). However, with the development of new analysis techniques, it is now possible to directly extract the vertical surfaces from moderately inclined (35–60°) sources (e.g. Pinte et al. 2018a; Paneque-Carreño et al. 2021; Rich et al. 2021; Law et al. 2021b, 2022). Analysing systems that host moderately inclined disks allows us to study them in three dimensions, as it is also possible to trace the azimuthal and radial distribution of material.
Of the handful of moderately inclined systems with direct extraction of their vertical surfaces, the vast majority have been analysed using only CO isotopologue emission (Pinte et al. 2018a; Paneque-Carreño et al. 2021; Rich et al. 2021; Law et al. 2021b, 2022; Leemker et al. 2022). The exceptions are AS 209, HD 163296, and MWC 480, where the vertical location of HCN and C2H emission was constrained in the inner ~ 150 au (Law et al. 2021b). However, the emission extends to over 300 au (Law et al. 2021a), and therefore a large portion of the vertical structure is still unconstrained. For Elias 2-27, the vertical location of CN has also been directly measured from the channel maps; additionally, by comparing the location of CN emission to that of CO isotopologues, its density and optical depth conditions were constrained (Paneque-Carreño et al. 2022).12CO and 13CO emission is expected to trace optically thick slabs of material in distinct vertical regions, while C18O likely traces closer to the midplane and CO freeze-out region (van Zadelhoff et al. 2001; Miotello et al. 2014). Through the study of CO isotopologues, it is possible to trace the temperature gradient in the vertical direction (Law et al. 2021b) and study CO abundance variations (Zhang et al. 2021).
Tracing the location of less abundant molecules can offer complimentary constraints on the disk structure and the physical-chemical processes that construct the environment conditions of planet formation. Emission from CN, HCN, and C2H is expected to originate from UV-dominated regions (Aikawa et al. 2002; Cazzoletti et al. 2018; Visser et al. 2018; Bergner et al. 2021; Guzmán et al. 2021). For these molecules, models predict that the emission should arise from elevated regions (van Zadelhoff et al. 2003; Cazzoletti et al. 2018; Cleeves et al. 2018; Bergner et al. 2021; Guzmán et al. 2021). HCO+ is a molecular ion. Its abundance is expected to be dominant in the CO molecular layer, and, combined with the CO isotopologue distribution, it can be used to study the disk ionization (Aikawa et al. 2021). Formaldehyde (H2CO) has two main formation pathways, gas-phase chemistry (Loomis et al. 2015) and grain-surface chemistry through the hydrogenation of CO ices (Hiraoka et al. 1994; Fuchs et al. 2009). H2CO could be a better tracer of cold gas in the outer disk if it originates from desorption processes off the dust grains; however, the emission may also arise from warmer and higher layers if gas-phase chemistry is dominant in its formation (Guzmán et al. 2021; Loomis et al. 2015). Direct tracing of the vertical location of the H2CO emission could shed light on the dominant mechanism leading to the formation of H2CO.
In this work we recover the location of the emitting regions for a sample of seven disks, using data from the Molecules with ALMA at Planet-forming Scales (MAPS) ALMA Large Program (#2018.1.01055.L, Öberg et al. 2021; Czekala et al. 2021) and archival ALMA data of Elias 2-27 (#2016.1.00606.S and #2017.1.00069.S; P.I. L. Pérez) and WaOph 6 (#2015.1.00168.S; P.I: G. Blake). The data selected for all the disks have sufficient signal-to-noise ratios (S/N) and resolution (spectral and spatial) to recover the vertical structure from multiple CO isotopologues and additional molecular tracers in each system. Elias 2-27 and WaOph 6 have spiral structures in the dust emission that have been studied at high angular resolution (Andrews et al. 2018; Huang et al. 2018b) and may be originated by gravitational instabilities (Pérez et al. 2016; Huang et al. 2018b; Paneque-Carreño et al. 2021; Veronesi et al. 2021). IM Lup, GM Aur, HD 163296, MWC 480, and AS 209 are sources studied by the MAPS collaboration, and each present a variety of dust and gas substructure (Öberg et al. 2021; Law et al. 2021a). Our complete sample is composed of a broad range in stellar parameters (0.5–2 M⊙) and disk substructures (spirals, rings, and gaps). The goal of this study is to offer observational constraints on the vertical location of the emission for a wide molecular reservoir, in a heterogeneous sample, and to relate the measured system properties to theoretical predictions.
The remainder of this paper is organized as follows. Section 2 details the data that were used and the methodology for extracting the vertical profiles. Section 3 presents our results: we first highlight the case of HD 163296, where we obtain vertical and radial profiles for ten molecules; then we show the CO emission location for all disks and study vertical modulations. This is followed by results on the radial brightness temperature profiles and an estimate of the disk gas pressure scale height. Finally, we present results for multiple molecules, other than CO, and detail our findings on the structured vertical profiles of HCN and H2CO. Section 4 presents a discussion of our main results, comparing our observational constraints to theoretical estimations, and in Sect. 5 the main conclusions of this study are highlighted.
2 Observations and method
2.1 Data
In this work we use the publicly available data from the MAPS ALMA Large Program (Öberg et al. 2021). For each disk in the sample we download the image cubes that were produced accounting for the incorrect default flux scaling of the CLEAN residual map (Jorsater & van Moorsel 1995), named from now onwards JvM corrected cubes (Czekala et al. 2021). An initial visual assessment is done to determine if a specific molecular emission from a disk can be used for extracting the vertical structure from the channel maps, following the methodology detailed in Sect. 2.2. Reasons for rejecting a molecule can be low S/N or lack of resolution to identify a Keplerian morphology in the channel emission. Table 1 shows the details of the selected files for each tracer, corresponding to those molecules for which it is possible to conduct our analysis in at least three disks. The dataset used may be identified by either the robust parameter or the beam size. For each molecule, the selected robust or beam size is the same for all disks in the MAPS sample. For datasets selected based on the robust parameter the difference in beam value between major and minor axis is typically of order ≤0.02″. Between sources there is also a slight beam size difference of ≤0.02″. At a distance of ~ 120 au this represents a difference of ~2.5 au; therefore, we consider beam size variations negligible in our calculations of the vertical profile. In addition to the information presented in Table 1, for HD 163296 we also study CN (N = 1−0, 113.499 GHz) and c-CзH2 (J = 707−616, 251.314GHz). The selection of these data is done by the beam size, 0.5″ for CN and 0.3″ for c-C3H2. A detailed study on HD163296 is presented in Sect. 3.1.
To the MAPS sample, we add publicly available data of Elias 2-27 and WaOph 6. In both sources we study 12CO J = 2−1 emission from The Disk Substructures at High Angular Resolution Project (DSHARP, Andrews et al. 2018). We also include 13CO and C18O J = 3−2 data of Elias 2-27 from ALMA programmes #2016.1.00606.S and #2017.1.00069.S (P.I: L. Pérez). Calibration and imaging procedures of Elias 2-27 can be found in Andrews et al. (2018) and Paneque-Carreño et al. (2021). For WaOph 6 we include archival data of ALMA programme #2015.1.00168.S (P.I. G. Blake) and the ALMA Large Program DSHARP (Andrews et al. 2018). After self-calibration we can detect emission from 12CO, 13CO, C18O, HCN, CN, and HCO+ J = 3−2 in WaOph 6. Due to the moderate spatial resolution of the dataset (0.3–0.4″), in this study we only analyse 12CO, 13CO, and HCO+ data, where we can confidently study the vertical distribution of the disk. The integrated moment maps for all molecules observed in WaOph 6 and details on the self-calibration steps are found Appendix A.
Overall, our sample consists on two Herbig and four T Tauri stars (Öberg et al. 2021; Andrews et al. 2018). There are three disks with spirals, and four with rings and gaps (Huang et al. 2018a,b). Additionally, various sources show distinct kinematical features such as signatures of late infall in GM Aur (Huang et al. 2021) and Elias 2-27 (Paneque-Carreño et al. 2021) and possible planetary perturbations in HD 163296 (Pinte et al. 2018b; Teague et al. 2018, 2021a; Izquierdo et al. 2022) and MWC 480 (Teague et al. 2021a).
Selected files for molecules in MAPS sample disks.
2.2 Method
2.2.1 Vertical profile extraction
To extract the emission surfaces we use the geometrical method outlined in Pinte et al. (2018a) as applied in Paneque-Carreño et al. (2021). Knowing the central star position and geometrical properties, the vertical profile of the upper emitting layer can be recovered directly from the channel map observations by tracing the location of the maxima of emission along each channel, assuming that they are tracing the isovelocity curve. For the MAPS sample, the data have been centred and aligned following the location of the continuum peak emission (Öberg et al. 2021), where we assume the central star is located. This same centring has been performed on the Elias 2-27 and WaOph-6 datasets, and therefore we consider the centre of the image as the stellar location. If the inclination, flaring, and resolution of the disk allow the identification of upper and lower surfaces, it is possible to confidently trace both vertical profiles independently. In cases when the surfaces cannot be visually identified separately we assume that the peak of emission of the channel map comes from the upper surface, which is expected to be brighter than the lower surface.
From the extracted location of the maxima, geometrical relations can be used to obtain the vertical profile of the emission (see Pinte et al. 2018a, for more details). To trace the maxima we use our own implementation of the method (ALgorithm For Accurate Height Over Radius, ALFAHOR), which relies on masking each channel through visual inspection to identify separately the near and far sides of the emission from the upper layer (see Fig. 1 for clarification). The masks are selected after the channel map emission has been rotated, using the position angles indicated in Table 2, such that the bottom side of the disk emission is towards the south. The maxima of emission are retrieved automatically, but only from sampling the pixels within the masks. The masks are selected with as conservative margins as possible to avoid a bias in the recovered structure and there are no particular criteria regarding maximum outer radius or any other value1. In this work, we only study the upper layer of emission, but in those cases where the lower layer can be identified (as can be observed for 12CO in Fig. 1) it would be possible to additionally trace the vertical extent of the lower layer.
Previous work for some of the disks and molecules in our sample (Law et al. 2021b) used a publicly available implementation of the Pinte et al. (2018a) method, DISKSURF (Teague et al. 2021b). In DISKSURF the search of the emission maxima can be blind or constrained with initial expected values of the minimum and maximum z/r, the minimum S/N and selected channels. While this allows for a systematic search and characterization of the channel emission, in some cases pixels from the bottom surface are incorrectly classified as located in the upper surface, and the other way around. This induces noisier vertical profiles, as there is a large data spread caused by the contamination of pixels from the lower surface of the disk. The S/N cutoff is also problematic when dealing with emission from less abundant molecules. By masking the channels after visual inspection, we reach locations of lower S/N and avoid contamination from the lower surface, obtaining a more accurate description of the vertical profile. Our implementation has been tested and illustrated in previous works (Paneque-Carreño et al. 2021; Leemker et al. 2022) and in this analysis we also compare it to the results of Law et al. (2021b) using DISKSURF (see Appendix B). Our results are consistent for bright tracers such as 12CO and 13CO, particularly in the inner region (<200 au). However, through our methodology we are able to trace a larger inventory of molecules to further radii.
For each disk and molecule we obtain the maxima from the channel maps by sampling every quarter of the beam semimajor axis in cartesian coordinates, after correcting for the disk position angle (PA). From all the obtained data points (see the Appendix B figures with all of the retrieved data points for each disk and tracer) we present the vertical profiles and the associated dispersion as the average value and the standard deviation within radial bins as wide as the beam semi-minor axis. In some disks, due to low S/N, there are fewer data points. To avoid biases due to lack of sampling, we only consider the data from radial bins where there are at least two independent data points. For Elias 2-27 it has been shown that there are azimuthal asymmetries in the vertical extent (Paneque-Carreño et al. 2021), but we do not find any indication of this behaviour in any of the other disks and molecules of our sample. Therefore, all of the data points are considered to compute the radial profiles. In the case of Elias 2-27 only the data points from the west side are considered. Table 2 details for each system the molecular emission from which we are able to produce vertical profiles.
Each emission surface in each disk and isotopologue can be parametrized using an exponentially tapered power law defined as
![$z\left( r \right) = {z_0} \times {\left( {{r \over {100{\rm{au}}}}} \right)^\phi } \times \exp \left[ {{{\left( {{{ - r} \over {{r_{{\rm{taper}}}}}}} \right)}^\psi }} \right].$](/articles/aa/full_html/2023/01/aa44428-22/aa44428-22-eq1.png) (1)
(1)
The best fit values for z0, ϕ, rtaper, and ψ in each system are found by using a Markov chain Monte Carlo sampler as implemented by emcee (Foreman-Mackey et al. 2019). For the fitting procedure, we consider all data points. If convergence is not reached for rtaper and ψ, or if rtaper is much larger than the radial extent of the profiles, we assume a simple power-law profile and fit only for z0 and ϕ. Table B.1 presents the computed parameters of the exponentially tapered or single power laws for each disk and CO isotopologue.
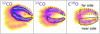 |
Fig. 1 Rotated 7.86 km s−1 channel map emission of the J = 2−1 transition of CO isotopologues in HD 163296. Overlaid are the regions masked as far and near sides of the upper surface in dashed and solid black lines, respectively. White dots trace the emission maxima within the masked regions. |
Studied systems, their properties, and the analysed molecules in each case.
2.2.2 Brightness temperature calculation
The brightness temperature (Tb) profiles are obtained from the peak intensity (I) using the complete Planck law. The relationship between both parameters is the following,
 (2)
(2)
where h is the Planck constant, k the Boltzmann constant, c the speed of light and v the frequency of the emission. The temperature profiles are computed from the azimuthally averaged peak intensity maps. To accurately de-project the data, we used either the best-fit power-law model or the exponentially tapered power-law model of each molecule. The azimuthally averaged peak intensity profile is obtained using the GoFish package (Teague 2019), a ±30° wedge across the semi major axis (as done in Law et al. 2021a) and radial bins half the size of the beam semi-major axis.
3 Results
3.1 The special case of HD 163296
HD 163296 stands out from the rest of the sample, as it is the disk where we were able to trace the emission layer for the highest number of tracers (see Table 2). For instance, it is the only system from the MAPS sample where we could obtain vertical profiles for CN and c-C3H2. HD 163296 is also a system of interest due to the detection of at least two planetary signatures at 94 and 261 au (Pinte et al. 2018b; Teague et al. 2018, 2021a; Izquierdo et al. 2022).
Figure 2 presents the emission surface and brightness temperature profiles of each studied molecule. The emission surface of 12CO has the highest z/r and traces a value of 0.3 up to ~350 au where it has a turning point and steeply declines. The emission surfaces of CN, HCN and 13CO J = 2−1 are located in the interval of z/r ~ 0.1−0.3. c-C3H2 and H2CO trace close to z/r ~ 0.1. C2H also follows z/r ~ 0.1, but its emission surface rapidly declines at r ~ 100 au. This is in agreement with the C2H vertical profile derived in Law et al. (2021b) for HD 163296. Below z/r ~ 0.1 is the emission of HCO+, 13CO J = 1−0, and C18O (only for the inner ~150 au in the case of C18O). Beyond ~200 au, the vertical profile of C18O elevates and traces a region closer to 13CO J = 2–1.
The right panel of Fig. 2 shows our results for the brightness temperature profiles of each tracer. By comparing molecules found at similar vertical locations, but with different brightness temperatures, we can estimate the optical depth of the emission (not presented in this work, but see Paneque-Carreño et al. 2022, for an example). In the case of optically thick tracers, the brightness temperature will be a probe of the kinetic temperature of the studied region.
As expected, due to its location, high abundance, and optical depth, 12CO has the highest brightness temperature. CN, HCN, and 13CO J = 2−1 emit from the same vertical region. However, 13CO J = 2−1 has a temperature of ~20 K, HCN is found at ~10 K, and CN at ~5 K. We expect 13CO J = 2−1 to be marginally optically thick, while theoretical models and observational constraints (Cazzoletti et al. 2018; Bergner et al. 2021) predict that CN and HCN are likely optically thin, which would lead to a lower brightness temperature, as measured in this work. For the z/r ~ 0.1 molecules, we trace similar temperatures for c-C3H2 and H2CO at Tb ~ 5 K and a higher temperature for C2H, with a strong dip at 75–85 au. This dip is also seen in the HCN and c-C3H2 profiles and coincides with a gap found in the line emission of these molecules (Law et al. 2021a). Finally, in the molecules closer to the midplane, 13CO J = 1−0 and C18O have a similar Tb ~ 18 K. HCO+ has a lower temperature profile, indicating it is likely optically thin with Tb ~ 8 K.
Besides optical depth differences, Leemker et al. (2022) show that differences in the spectral resolution may lead to variations in the extracted brightness temperature. Lower spectral resolution data will result in lower brightness temperature ranging from 10–60% depending on the resolution difference (see Appendix A.3 in Leemker et al. 2022). From the MAPS data, all observations of Band 6 (211–275 GHz) have a velocity resolution of 0.2 km s−1 whereas observations taken in Band 3 (84–116GHz) have a resolution of 0.5 km s−1. Therefore, CN, HCO+, and 13CO J = 1−0 would likely have higher brightness temperature profiles if we compared them at the same spectral resolution as the rest of the tracers. The brightness temperature of all molecules shows a steep turnover in the inner 50 au, which is likely due to effects of beam smearing. At the source distance, the beam major axis of each tracer takes a value between 13 and 30 au and 50 au in the case of CN. Additional perturbations in the temperature profiles may be due to line flux subtraction from the continuum emission, as we are using the continuum-subtracted datasets. The dust features are indicated in the top of the right panel of Fig. 2 for reference.
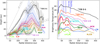 |
Fig. 2 For HD 163296, vertical emission profiles (left panel) and azimuthally averaged peak brightness temperature profiles (right panel) for various tracers, beyond CO isotopologues. Solid coloured lines show the mean value in each profile and shaded regions the 1σ data dispersion. The vertical blue lines in the right panel indicate the location of the millimetre continuum gaps and the ring detected by Huang et al. (2018a). |
3.2 CO isotopologue vertical structure of the full sample
The extracted emission surfaces of the CO isotopologues from the complete sample of disks are presented in Fig. 3. As explained in Sect. 2.2, we are able to trace the emitting layer out to a larger radial extent than the previous work on the MAPS sample (Law et al. 2021b). The main difference is in the C18O J = 2−1 emission, which at larger radii is observed to trace a region very similar to 13CO J = 2−1. This is seen in all disks where both isotopologues are available and is in agreement with previous IM Lup (Pinte et al. 2018a) and Elias 2-27 (Paneque-Carreño et al. 2021) analysis. We are also able to compute a vertical profile for 13CO J = 1−0, which mostly traces a layer below 13CO J = 2−1, except in MWC 480 and AS 209 where both transitions are very close to the midplane.
The sample is divided into three groups, indicated by the three separate rows of Fig. 3. This classification depends on the z/r values that the 12CO traces and the radial extension of the emission. IM Lup, GM Aur and Elias 2-27 are the most vertically extended disks, with z/r ≥ 0.3. HD 163296 and MWC 480, the two Herbig Ae disks, have a 12CO vertical profile that traces z/r ~ 0.3. Finally, AS 209 and WaOph 6 are the flattest and least radially extended disks in our sample, with z/r ~ 0.1−0.3.
In some cases, such as for 12CO in Elias 2-27, we lack sampling of the outer regions due to cloud absorption (Pérez et al. 2016; Paneque-Carreño et al. 2021). In this case the obtained best-fit for the vertical profile (methodology described in Sect. 2.2) follows a single power law. However this description of the data may only be valid in the inner ~ 100 au of the disk. For C18O and 13CO (J = 1−0) it is necessary to fit with a single power-law model in all disks due to the flat morphology or lack of turnover in the measured profile. It is important to emphasize that this does not mean there is no turnover as our parametric description is only valid up to the sampled radial location.
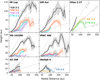 |
Fig. 3 Vertical profiles for CO isotopologues as extracted from the channel maps of each disk. The shaded region shows the dispersion of the data points, and the solid coloured line traces the average values within each radial bin. Note that Elias 2-27 and WaOph 6 were observed at a higher transition (J = 3−2) in some CO isotopologues. Solid grey lines show a constant z/r of 0.1, 0.3, and 0.5. Each row has a different vertical extent. |
3.2.1 Modulations in the surface and correlation to kinematical and dust features
Even though the data can be fitted using a power law, the vertical profiles in Fig. 3 show modulations or ‘bumps’. This behaviour is identified in the 12CO surface of HD 163296, MWC480 and IM Lup. To trace the deviations from the possibly smooth vertical profile, a reference profile is assumed, which we refer to as the ‘baseline’ (see Fig. 4). This baseline does not coincide with the previously derived best-fit power-law or exponential profiles, which are not considered for this analysis because they cut through some of the features seen in Fig. 3. It is important to note that the retrieval of vertical modulations will strongly depend on the assumed baseline, which we cannot know with certainty without dedicated modelling and understanding of the properties of each disk.
We assume a baseline that traces the averaged vertical profile such that it follows a positive gradient at all radial locations. If there is a turnover, after which modulations are observed, we allow the baseline to follow only negative gradients, from the location where no further positive gradients are found. The final baseline profile is subtracted from all the data points and we compute the binned residuals. It is assumed that data with lower vertical values with respect to the baseline trace modulations and we fit Gaussians at these locations. The amount of Gaussian features to be fitted and the initial guess on the radial location are determined through visual inspection of the residual data points. The best-fit surface is obtained by simultaneously fitting multiple Gaussians to the assumed baseline. The fit is done considering all of the retrieved data points from the channel map analysis, the binned data are only used to determine the baseline and to aid visual inspection. This process is schematically shown in Fig. 4.
The 12CO and 13CO J = 2−1 isotopologues are analysed for HD 163296, MWC 480 and IM Lup, which are the disks and tracers where this behaviour is most clearly identified. C18O is also analysed for HD 163296 and MWC 480, but as no modulations are found in IM Lup the analysis is not shown in this section. Detailed plots and values for each tracer and disk can be found in Appendix B. The best-fit models of 12CO and 13CO are shown overlaid on the data in Fig. 5, where we compare the locations of the modulations in different tracers with the location of the dust rings and gaps found in ALMA millimetre continuum emission images (Huang et al. 2018a) and reported kinematic features (Teague et al. 2021a; Izquierdo et al. 2022).
HD 163296 displays a tight correlation between all of the modulations in both tracers. Additional analysis of the C18O emission in HD 163296 also finds modulations at similar radial locations as the inner three structures reported in 12CO and 13CO. In MWC 480 we find a feature in 12CO and C18O that does not seem to have a correspondent in 13CO, at 150 au. IMLup has a strong feature at 393 au that is recovered in both tracers; however, the other modulations do not relate between isotopologues. Contrary to the other disks, IM Lup does not have visually identifiable drops in the vertical height in the inner 300 au and the features we obtain are broader than in the other systems. It may be that in this case we are tracing the flaring of the inner disk that due to our linear baseline is not considered properly in our reference surface model.
It is found that HD 163296 and MWC 480 present a strong correlation between the location of millimetre continuum emission gaps (Huang et al. 2018a) and vertical modulation in the gas emission. A correlation is also found between the radial location of kinematic deviations detected in residuals from the velocity maps (Teague et al. 2021a; Izquierdo et al. 2022) and the vertical modulations traced in both HD 163296 and MWC 480. In contrast, there is no relation between the emission gaps and rings traced from the integrated emission maps (Law et al. 2021a) in either CO isotopologue for any of the disks. An additional caveat to these results may be that the extraction of the emission surfaces assumes a smooth Keplerian motion of the material (Pinte et al. 2018a) and strong deviations could be responsible for the features we detect, precisely quantifying this effect will be studied in a future work. However, the vertical modulations are recovered for the complete azimuthal range, they are not localized in azimuth as is the case for planetary kinks (e.g. Pinte et al. 2018a; Pérez et al. 2018; Izquierdo et al. 2021). Considering that the emission surfaces extracted for 12CO and 13CO are expected to be related to the surfaces of τ =1, it is likely that the recovered modulations trace actual physical perturbations and decreases in the emitting surface or column density of CO. We comment on this further in Sect. 4.
In an analysis of vertical modulations, Law et al. (2021b) studied the inner ~ 100 au for the MAPS sample, and our results recover all of the features previously reported in HD 163296 and MWC 480. The depths and widths of our features slightly differ in some cases from the previous characterization due to the differences in extracting the vertical profile and in computing the assumed surface. The depth of each modulations is computed in the same way as in Law et al. (2021b). We consider the height value of the assumed surface at the feature location (z(r0)) and the height depletion caused by the Gaussian feature (∆z), which is equivalent to the fitted amplitude. The ratio between these numbers results in a percentual description of the depletion from the assumed surface value. Higher depth values indicate a larger relative decrease in the scale height value. Our results show that, for features that are found in both tracers at similar locations, the relative depth in 13CO is larger than 12CO for all cases. Exact values are found in Appendix B.
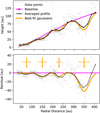 |
Fig. 4 Example of baseline and best-fit Gaussian modulation extraction for the MWC 480 12CO dataset. |
3.2.2 Brightness temperature profiles
As done in HD 163296, we obtain the brightness temperature profiles for the CO isotopologue emission of the complete sample. In particular, for Elias 2-27 we use only the emission from the east side, due to the elevation and brightness asymmetries (Pérez et al. 2016; Paneque-Carreño et al. 2021). WaOph 6 and AS 209 also have strong absorption and a brightness asymmetry. Therefore, for the azimuthal profiles we only considered the south and west sides, respectively. The rest of the systems have their profiles extracted using a ±30° wedge across the semi major axis.
Figure 6 shows the results for each system and CO isotopologue. The ordering in the panels matches Fig. 3. The most vertically extended disks are in the top row, the intermediate disks in the middle row and the smaller, flatter disks in the bottom. All disks show a slowly decreasing temperature profile towards larger radii. Elias 2-27, HD 163296, MWC 480 and WaOph 6 show a steeper slope in the temperature decrease of 12CO. HD 163296 and MWC 480 also display higher temperatures for all isotopologues, which is expected as they are both warm Herbig disks orbiting more luminous stars. In all disks from the MAPS sample 13CO J = 1−0 and C18O J = 2−1 trace the same brightness temperatures, which are mostly below the CO freeze-out value (~21 K). This happens particularly at radii beyond 80 au for the Herbig stars, but at all radii for IM Lup, GM Aur and AS 209. We note that, as discussed previously, the spectral resolution of 13CO J = 1−0 is lower than that of the other transitions, which may artificially result in lower brightness temperatures (Leemker et al. 2022). Very low brightness temperatures may also be indicative of low optical depths of the studied isotopologues and do not represent the kinetic temperature of the gas at that location. High optical depth tracers, such as 12CO are expected to have brightness temperature profiles that are better tracers of the kinetic temperature at their location.
The vertical dashed lines in Fig. 6 show the location of the modulations in the vertical surface of 12CO for IM Lup, HD 163296 and MWC 480 (see Sect. 3.2.1). While the temperature profiles do not show such strong features, slight modulations are distinguished that may be coherent with the locations of the vertical modulations. We tentatively detect relations between dips in the brightness temperature profiles of 12CO and the location of the vertical modulations. Future detailed modelling of each source must be conducted to determine if the variations in the temperature profile are sufficient to explain the drops in the CO emission layer and determine the causes.
Even though the measured 12CO vertical profiles of each disk are different and allow the classification of the sample in three categories based on vertical extension, the brightness temperature profiles of 12CO are very similar. Considering only the disks from the MAPS sample, there is a clear difference in the 12CO temperatures of T Tauri and Herbig Ae stars, as has already been reported in Law et al. (2021b). However, within the T Tauri stars, the vertical extent of the 12CO emission in the disks is twice as large in IM Lup and GM Aur than in AS 209. WaOph 6 and Elias 2-27 are also T Tauri stars and both show a warmer 12CO inner disk than the other low mass stars from the MAPS sample.
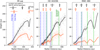 |
Fig. 5 Data corresponding to 12CO J = 2−1 (in black) and 13CO J =2−1 (in orange) for three disks where modulations in the vertical surface are detected. Coloured dots indicate the extracted data from the channel maps for each tracer. Continuous lines trace the best-fit surface considering the reference baseline and a number of fitted Gaussians. The location and width of the Gaussians for each molecule are signaled at the top of each panel. Vertical blue lines trace the dust structure from Huang et al. (2018a). Vertical green lines show the reported kinematic residuals from Teague et al. (2021a) and Izquierdo et al. (2022). |
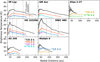 |
Fig. 6 Brightness temperature profiles of the CO isotopologue emission in each disk. The solid line indicates the mean value and the shaded region the standard deviation within each radial bin, divided by the number of beams in each annulus. The vertical and radial scales are the same in each panel. Dashed vertical lines in IM Lup, HD 163296, and MWC 480 indicate the location of the vertical modulations determined in this work for 12CO. |
3.2.3 Calculation of disk scale height
We have presented the vertical location of several CO isotopologues in a sample of disks. However, this emission surface depends on several physical-chemical conditions. A more transverse characterization of a disk’s vertical structure is given by the gas pressure scale height (H), which can be used to compare theoretical models with observations. In order to derive this information, we design a simple single layer model. Despite the simplicity of the model, this allows us to provide first quantitative estimate of the material distribution. Assuming that the disk is vertically isothermal it is possible to relate the scale height to the total volumetric gas density (ρgas) and the surface density of the disk (Σ) through
 (3)
(3)
We expect our derived vertical profile of 12CO to trace the region where the emission becomes optically thick (τ ≥ 1) or where CO becomes self-shielding. For 12CO (J = 2−1) at a temperature of 40–60 K this occurs when the vertically integrated column density of 12CO reaches the critical value NCO,crit ≃ 5 × 1016 cm−2 (resulting in τCO ~ 1, values obtained using the RADEX online simulator, van der Tak et al. 2007). As we are studying CO column density, we assume a constant x(CO) abundance of 2.8×10⁻⁴ with respect to H2 in the disk (Lacy et al. 1994; Zhang et al. 2021), such that ∑CO = ∑x(CO). Therefore, we can relate our derived vertical 12CO location (zCO) to the scale height of the disk and critical column density following
 (4)
(4)
To solve Eq. (4) we used a change in variable such that z′ = z/H and obtained an equation that can be solved numerically at each radial location where we have information on the 12CO emitting layer (zCO), to obtain the disk scale height if the emission is optically thick:
 (5)
(5)
Considering the surface density best-fit parameters derived from models in Zhang et al. (2021), we obtain the scale height profiles from our measurements for the disks in the MAPS sample. We note that the CO depletion profiles from Zhang et al. (2021) are not considered because they are obtained for C18O and C17O, and therefore we would have to make assumptions on the isotope ratios to convert them into 12CO depletion profiles, adding an additional uncertainty (Miotello et al. 2014). This analysis is not done for Elias 2-27 and WaOph 6 as we do not have a model of the surface density and replicating the study of Zhang et al. (2021), which involves thermochemical modelling and radiative transfer, is beyond the scope of this work. Figure 7 shows our estimation for the scale height based on the best-fit parametrization of 12CO surfaces, compared to the scale height profiles from the best-fit models studied in Zhang et al. (2021). Our results are in agreement with the models and with the canonical assumption of H/R = 0.1 for a standard irradiated disk beyond ~ 100 au (see Eq. (5) in Lodato et al. 2019).
For IM Lup and HD 163296 there are also estimates on the pressure scale height from the location of the scattered light surfaces (Ginski et al. 2016; Avenhaus et al. 2018; Rich et al. 2021). Our values for the gas pressure scale height are below these estimates in both cases. The results show a layering where the 12CO emitting surface is the most vertically extended, followed by the scattering surface and then the gas pressure scale height (see Fig. C.2). The latter is in agreement with expectations from theoretical models, where the gas pressure scale height is estimated to be 3–4 times lower than the scattering surface (Chiang et al. 2001; Ginski et al. 2016). Our results display a difference of only 1.5–2 between the scattering surface and the gas pressure scale height. We note that the estimates we obtain of the pressure scale height strongly depend on the assumed density profile and CO abundance (x(CO)). Low densities (ΣCO below or close to the assumed CO critical density) push the pressure scale height to large values, up to a factor of a few, with respect to the derived CO emission layer. This indicates that if we would consider a depletion factor in the CO abundance then the H/R value would increase.
To test the robustness of our method we perform 2D thermochemical models with DALI (Bruderer 2013), using the gas surface density prescription of Zhang et al. (2021) and creating mock channel maps to retrieve the 12CO J = 2−1 vertical profile (zCO) for applying our methodology. The model details can be found in Appendix C.3 and the results of our test are displayed in Fig. 8. We observe that, as expected in our model, the emitting layer we retrieve for 12CO from the mock channel maps is located at a similar height than the CO optical depth of τCO ≥ l. The optical depth value is an output of the DALI models and is calculated at each radial point by vertically integrating towards the disk midplane the sum of line and dust opacities and then subtracting the dust only integrated opacity value. In some cases, the measured vertical profile for 12CO emission traces a location closer to the disk midplane; therefore, it traces an optically thicker region reaching values of τCO ~ 100. This difference in the expected location of the 12CO emission does not seem to be related to any projection effects, such as disk inclination (see Fig. C.4). IM Lup is the system that traces higher τCO in the outer disk and is also the source with the highest disk mass and radial extent (see Table C.1). The resulting synthetic channel maps in this system are harder to trace in the outer radii than for the other sources, due to sudden brightness variations in the emission. The effect of this difficulty is reflected by the spread in the data points at 150–200 au and low sampling further out (see Fig. 8). Additionally, HD 163296 and MWC 480 show features in the model vertical structure that seem like the modulations studied in the previous section; however, it is uncertain if this is an actual physical effect or a structure that appears due to the coarser model resolution in the outer disk region. A future study focused on thermochemical models will aim at understanding the parameters that affect the exact location of the emission. The models shown in this section are just first approximations to future theoretical work and are not analysed in detail here.
Using the extracted vertical profiles from the models, we apply our method to obtain the pressure scale height and recover an almost exact match to that of the scale height used as input for each source (see Fig. 8). Differences between the inferred pressure scale height and the model input value are most apparent in the outer regions (r ≥ 250 au), where the emission comes from more optically thick zone (most apparent in IM Lup as mentioned before; see Fig. 8). A plot relating the conversion factor between the 12CO emitting layer and the gas pressure scale height, for different τCO values can be found in Appendix C.
While this observationally driven derivation of H should be considered as an approximate first trial on describing the disk pressure scale height using the location of CO emission, our initial test with thermochemical models show it is a good approximation. We expect this method to hold if the gas in the disk follows Keplerian rotation, 12CO emission is optically thick and the vertical distribution is similar to a Gaussian profile. Under these assumptions, our estimate shows that all systems have scale heights between H/R of 0.1–0.2 (Fig. 7), which is in agreement with theoretical predictions. An important caveat to our comparison with DALI models is that we have tested our method (Eq. (5)) with a model that uses a Gaussian distribution for the vertical profile (see Appendix C for details), which is our initial assumption for inferring the pressure scale height (Eq. (3)). While our tests are an important check to assure that our method is consistent, future work must focus on the errors that may appear if the vertical density profiles deviate from a Gaussian profile and consider an analytical disk prescription that gives a better representation of the vertical temperature structure (e.g. Chiang & Goldreich 1997; Dullemond et al. 2002).
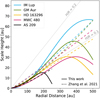 |
Fig. 7 Derived gas pressure scale height (H) for each of the disks in the MAPS sample (in solid coloured lines) from our analysis of the 12CO emitting surface. Dashed lines show the predicted scale height for each disk from Zhang et al. (2021). Solid grey lines show the location of constant H/R at 0.1 and 0.2. |
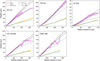 |
Fig. 8 Results on the vertical location for 12CO (pink line) and the inferred pressure scale height (blue line). The 12CO vertical location is obtained with ALFAHOR through the analysis of mock channel maps generated from a DALI model that uses the surface density prescription from Zhang et al. (2021) for each disk. Points extracted from the synthetic channel maps are shown in grey for comparison with the average value (zCO). The inferred pressure scale height is calculated following Eq. (5). The pressure scale height used as input for the DALI models (H) is shown for comparison (yellow line). Dashed, dot-dashed, and dotted lines show the model location of the CO millimetre optical depths (τCO) 1, 10, and 100, respectively. |
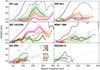 |
Fig. 9 Vertical profiles of the emission surface for molecules other than CO isotopologues in the studied disks. Elias 2-27 is not shown due to a lack of data in other tracers. Black curves show the location of the CO isotopologues in the J = 2−1 transition for reference. The solid line is 12CO, the dashed line 13CO, and the dotted line C18O. Each coloured curve shows a different tracer, where the solid line is the mean value and the shaded region shows the dispersion of the retrieved data points within each radial bin. Grey lines mark a constant z/r of 0.1, 0.3, and 0.5. |
3.3 Other tracers
For the MAPS programme targets we are able to trace the vertical profile of HCN, H2CO, HCO+ and C2H in the same way as with the CO isotopologues. In the case of WaOph 6, the lack of spectral and spatial resolution in the data only allowed us to recover the surface of HCO+, even though HCN and H2CO emission data are available too (see Appendix A). The vertical profiles of these molecules are shown, compared to the CO vertical layers, in Fig. 9. Elias 2-27 has observations of CN N = 3−2 hyperfine transitions from which the emitting surface has been recovered (Paneque-Carreño et al. 2022). However, as we are able to recover the emitting surface of CN N = 1−0 only in HD 163296 (shown in Fig. 2), we do not display this molecule in Fig. 9.
3.3.1 Complete sample
Molecules beyond CO isotopologues seem to mostly reside close to the midplane. Due to this, we are not able to visually separate upper and lower sides of the disk when masking the channel maps to extract the vertical profiles. This implies that there could be some contamination and scatter caused by the lower side of the disk. Additionally, for some tracers the vertical extent of the emission is comparable with the beam size, and therefore the profiles of these molecules are considered tentative results. Higher spatial resolution and better S/N data may allow us to constrain them in more detail in the future. The gaps in the vertical profiles are due to lack of data (under two points) in the radial bin (see Sect. 2). We note that our results are in agreement with those obtained by Law et al. (2021b) for HCN and C2H in the inner ~ 150 au.
The overall average z/r values of each tracer are shown in Fig. 10. As various tracers have different turnover radii and extent, we follow a similar approach to Law et al. (2022) and consider the emission only from within 80% of the 13CO J = 3−2 rtaper. For MWC 480 and AS 209 we use 12CO, as no turnover is detected in 13CO (see Table B.1). The emission from most tracers beyond CO isotopologues has a large scatter, but overall comes from regions with z/r ≤ 0.1 (see the right panel of Fig. 10). This is in agreement with the flat morphology of the channel maps and the assumptions of flat disk used in MAPS for emission other than CO (e.g. Law et al. 2021a; Guzmán et al. 2021; Bergner et al. 2021). HCN rises from an upper layer only in HD 163296 and HCO+ shows a moderate elevation in IM Lup, AS 209 and WaOph 6. H2CO has a consistent behaviour across all stellar masses, with z/r ~ 0.1. The emitting surface of CN can only be traced in Elias 2-27 and HD 163296. Both disks show CN is the highest emitting molecule, aside from 12CO. However, in Elias 2-27 it traces the same region and in HD 163296 it is in a middle layer closer to the rest of the molecular reservoir.
The stars in Fig. 10 are ordered in the horizontal axis by increasing stellar mass; however, the scale is not linear as several of them have almost equal mass value (see Table 2). A tentative relation between the z/r values of CO tracers and stellar mass may be recovered from the left panel of Fig. 10 such that z/r decreases with increasing stellar mass. This relationship has been tested for 12CO (Law et al. 2021b, 2022) and in this work we tentatively recover it for 13CO J = 2−1 and C18O J = 2−1 too (orange and light blue dots in Fig. 10). Contrary to the behaviour of its higher transitions, 13CO J = 1−0 emits from a lower z/r ≤ 0.1 layer and does not have any correlation to the stellar mass. Considering the mean values we note that 13CO J = 2−1 lies in a vertical region 2–3 times lower than 12CO J = 2−1 for all the disks in the MAPS sample. This also applies for WaOph 6 in J = 3−2 transitions, but for Elias 2-27 13CO is located closer to 12CO and the ratio between their mean values is 1.5.
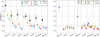 |
Fig. 10 Average z/r values of each tracer and disk under study. To avoid the effect of the turnover in the case of vertically extended molecules, only data within 80% of the 13CO (or 12CO for MWC 480 and AS 209) rtaper is considered. Note that for Elias 2-27, CN is a higher transition (N = 3−2) than the CN shown in HD 163296 (N = 1−0). |
3.3.2 Structure in HCN and H2CO
The HCN and H2CO vertical profiles are well sampled (see all of the extracted data points in Appendix B) and show distinct morphologies, which in most cases do not follow an exponentially tapered power law or a single power-law model. These profiles are presented separately in Fig. 11 for all disks in the MAPS sample except MWC 480, which is not included due to the lack of data points for HCN emission. Overlaid on the profiles are the locations of rings and gaps found in the integrated emission of each corresponding molecule and the edge of the millimetre continuum (Law et al. 2021a).
HCN shows a step-like profile in HD 163296, with peaks that mostly coincide with gaps in the integrated HCN emission. IM Lup shows a peak in the HCN profile at ~270 au, which is in between a gas gap and a ring and also coincides with the single peak seen in the H2CO vertical profile. GM Aur and AS 209 may have tentative HCN peaks around ~ 150 au; however, the data do not allow us to properly characterize the profiles and there is a large dispersion in the recovered data points from the channel maps. While HCN is expected to trace high layers in the disk atmosphere (Visser et al. 2018; Bergner et al. 2021), it is clear that this is only the case in HD 163296 (see also Fig. 10).
The H2CO vertical profiles can be traced with less scatter in all disks and for HD 163296, IM Lup and GM Aur we see clear peaks. In all cases there seems to be a peak close to and just inwards with respect to the edge of the millimetre continuum. The peaks in the vertical profile of HD 163296 and IM Lup coincide with gas gaps, as was the case for HCN. GM Aur has gas rings and gaps detected only in the molecular emission at small (< 100 au) radii; however, it has a strong, well constrained rise in the emitting layer close to the continuum edge.
In HD 163296 and IM Lup there seems to be a correlation between the presence of line emission gaps and the peaks in the vertical structure for both HCN and H2CO. It could be that the substructure of the molecular emission affects our profiles, as we are tracing the data directly from the channel maps, assuming that the emission maxima trace an isovelocity curve. However, we do not see this effect in GM Aur, where H2CO also has a strong vertical perturbation, and we note that most of the gaps in the molecular emission at outer radii in HCN and H2CO have a very low-contrast (Law et al. 2021a). Therefore, we do not expect them to have such a noticeable impact on the retrieved profile. All vertical profiles show peaked features beyond the continuum emission border, and therefore it is also unlikely that this is an effect of continuum over-subtraction. Overall, if the emission is optically thin, which is expected from the brightness temperature profiles of HD 163296 (Fig. 2) and previous studies (Bergner et al. 2021; Guzmán et al. 2021), the vertical profiles seem to be tracing distinct variations of the physical location from where HCN and H2CO are being emitted.
4 Discussion
4.1 CO isotopologue vertical layering
There have been dedicated studies to predict the regions from where molecules emit in protoplanetary disks (van Zadelhoff et al. 2001; Aikawa et al. 2002; Walsh et al. 2010; Miotello et al. 2014; Woitke et al. 2016). We trace the location of the emitting region for various CO isotopologues in our seven disks, including different transitions of 13CO in the MAPS sample and 12CO in WaOph 6. Our analysis shows that 12CO emission comes from a wide range of vertical locations, which is in agreement with previous studies (Law et al. 2021b, 2022). This does not correlate directly with the emission location of other CO isotopologues or different molecules, except possibly 13CO (see Sect. 3.3 and Fig. 10).
We take as reference the work by van Zadelhoff et al. (2001), where literature disk models are processed using a full 2D Monte Carlo radiative transfer code to determine the vertical location of the emitting surfaces for CO and HCO+ isotopologues. The locations traced for the CO isotopologues in our work are qualitatively compared with the expected location of CO for a chemical abundance similar to the interstellar medium (ISM), and a more depleted abundance. In both scenarios it is expected to have a layering where 12CO traces the upper layers, followed by 13CO and C18O, considering all transitions (see also Miotello et al. 2014). For the disks in the MAPS sample, we clearly recover that 12CO emission comes from a higher region than 13CO. Also, for 13CO the J = 2−1 transition emission surface is above the J = 1−0 transition, as expected. However, we observe that C18O J = 2−1 is emitting from a layer very close to 13CO J = 2−1 and in most cases above 13CO J = 1−0, which is not expected from the models. This overlap in the emission regions of C18O J = 2−1 and 13CO J = 1−0 could be explained by both of them emitting from just above the CO freeze-out region, which is also coherent with the measured low brightness temperature (see Fig. 6). Indeed, it has been proposed that C18O J = 2−1 emission in IM Lup traces the freeze out (Pinte et al. 2018a). Our new results showing that13 CO J = 1−0 emits from the same region or even closer to the midplane may be additional evidence of the freeze-out region location. C18O J = 1−0 is also detected for the MAPS sample but unfortunately, due to the low S/N of this transition, it is not possible to trace its emitting surface, which would be useful for additional comparison.
In WaOph 6 12CO J = 3−2 and J = 2−1 trace the same region, which is in agreement with the previously discussed theoretical models. Future work obtaining observations at higher transition such as 12CO J = 6−5 could help differentiating between a depleted or ISM-like abundance, depending on how similar the emitting region is to that traced by lower transitions (van Zadelhoff et al. 2001). Elias 2-27 shows a highly elevated emission layer, where the J = 3−2 transitions of 13CO and C18O are very close to the 12CO J = 2−1. These two disks do not have a detailed description of their surface density or temperature structure, which would be useful for comparing them with the rest of the sample and obtaining the gas pressure scale height. Both disks have spiral structures in the dust continuum emission, which have been proposed to be linked to the effects of the disk self-gravity (Huang et al. 2018b; Paneque-Carreño et al. 2021). Our results show that in the line emission they both have very different structures, both radially and vertically; therefore, it remains unclear how dust continuum features relate with the vertical material distribution.
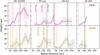 |
Fig. 11 Vertical surface profiles for HCN (top row) and H2CO (bottom row). The green vertical line marks the edge of the dust continuum as reported in Law et al. (2020a). The solid and dashed lines in each panel mark the rings and gaps, respectively, found in the emission maps of each molecule from Law et al. (2020a). In the profiles, the solid line marks the mean value and the grey shaded area the dispersion of the retrieved data points in each radial bin. |
4.2 Vertical distribution of other molecules
Our work presents direct constraints of the emitting location for several molecules, extended to radial distances beyond ~ 150 au. Overall, the results show that most of these molecules emit from regions very close to the midplane (z/r < 0.1; see Fig. 10), which conflicts with theoretical predictions, in particular when analysing the location of UV sensitive tracers such as HCN and C2H (Aikawa et al. 2002; Walsh et al. 2010; Bergner et al. 2021; Guzmán et al. 2021).
Various physical-chemical models have predicted that CN and HCN emission should be sensitive to UV flux (Cazzoletti et al. 2018; Bergner et al. 2021). The emitting layer of HCN should be located just below CN, due to the higher photodissociation rate of HCN compared to CN (Bergner et al. 2021). Overall, the emission of both tracers is expected to arise from the upper atmosphere of disks, in regions close to the 12CO emitting layer (see also Walsh et al. 2010). The only system where we are able to extract the emitting surfaces of both tracers is HD 163296. In this disk we find that CN J = 1−0 emission is located in an intermediate layer, between 12CO and 13CO J = 2−1 (see Figs. 2 and 10). In all the other disks, except for Elias 2-27, it is not possible to extract CN surfaces and HCN traces a region close to the midplane (z/r < 0.1). Observing emission from regions closer to the midplane may be an indicator of deeply penetrating UV flux either from the central star or from an external source (see models by Flores et al. 2021). Another alternative is that X-ray radiation is responsible for the emission, as suggested for the Flying Saucer system (Ruíz-Rodríguez et al. 2021). Ultraviolet radiation is deeply affected by the location of small dust particles, and therefore the constraints on the emitting surfaces shown in this work may be used for dust growth and settling models in disks through simultaneous modelling of the dust location, UV radiation and molecular excitation. C2H is also a molecule expected to be a good UV tracer (Miotello et al. 2019; Guzmán et al. 2021) and even though it is less radially extended, in the inner disk it traces the same region as HCN. Future observations of higher CN transitions may allow us to study the distribution of this molecule for the rest of the sample and compare its location with the retrieved HCN emitting region.
Models suggest that HCO+ should be emitting from a region similar to the CO emission layer (Aikawa et al. 2002). We find that the average z/r of the molecule is indeed close to C18O. In IM Lup, AS 209 and WaOph 6 the emission comes from above z/r of 0.1. These disks are expected to be the youngest of the sample (Huang et al. 2018b; Öberg et al. 2021), which could imply they have had less chemical reprocessing and CO abundances similar to the ISM. Disks in which CO has been transferred into other species (expected for older systems) have HCO+ emission located closer to the midplane, compared to models with ISM-like abundances (van Zadelhoff et al. 2001). Constraints from the measured excitation temperature of H2CO (Pegues et al. 2020) and chemical models (Walsh et al. 2010) also predict that it should be located in the molecular layer, but above the CO freeze-out region. Indeed, we trace the emission from H2CO in a very similar region to that of C18O and HCO+.
The morphology of the HCN and H2CO emitting layers show a distinct peaked structure (see Fig. 11). A possible relation is observed between the location of radial gaps in the molecular distribution and the peaks in the vertical profile. H2CO is a molecule that has two formation pathways, it may emit due to desorption processes, from dust grains close to the midplane, or warm gas phase chemistry (Terwisscha van Scheltinga et al. 2021; Carney et al. 2017; Guzmán et al. 2021). The distinct surfaces we trace in H2CO could be the first direct indication of regions where different emission mechanisms are acting. In particular, modelling of HD 163296 by Carney et al. (2017) predicts that in order to reproduce the radial intensity profile the outer disk (beyond the millimetre edge) must have an increased H2CO abundance. The model considered a higher abundance compared to that of the inner disk that extends vertically (see Fig. 5 of Carney et al. 2017, for the R-step case), which is coincident with the peak traced in the emission surface of H2CO in HD 163296 beyond the millimetre edge (see Fig. 11). It is important to note that the results of Carney et al. (2017) showed that the H2CO could not be produced uniquely by gas-phase reactions. Our vertical profile shows that at radius ~240 au the emission comes from closer to the midplane, which would be coherent with thermal desorption of the molecule from icy grains.
Previous works focused on H2CO emission have not recovered the structure we see in this study. However, models for DM Tau that consider gas-phase and grain chemistry recover a bulged H2CO density structure in the vertical profile (Loomis et al. 2015). This bulged feature is expected at a higher elevation than what we trace in our vertical profiles and may not necessarily be reproduced in the emission surface. Pegues et al. (2020) find that measurements of the H2CO excitation temperature in various systems show mostly constant radial temperatures; however, clear peaks are detected in LkCa15 and J1604-2130. If the densities are sufficient to assume that the emission is in local thermodynamic equilibrium, then the excitation temperature may be a proxy of the kinetic temperature and thus the vertical emission distribution. For HCN there are no sources in the literature that show evidence of a structured vertical distribution, and the excitation temperature profiles derived for the MAPS sample do not have any noticeable relation to the features seen in our vertical profiles (Guzmán et al. 2021).
4.3 CO modulations: Correlation to millimetre gaps and kinematic features
Vertical structure is found in the CO isotopologue emission for IM Lup, HD 163296 and MWC 480, this structure can be modelled as drops from a determined baseline, using Gaussian functions (see Sect. 3.2.1). We name these drops modulations. There seems to be a consistent relation between the locations of the modulations, gaps observed in millimetre continuum and kinematical residuals. As the emission surfaces are traced directly from the channel maps there are several possibilities regarding their origin. It could be that, if the kinematical features are caused by a planetary companion, the vertical modulations are a tracer of the material infalling and possibly accreting on to the planet. The kinematic residuals used in this work have all been related with the presence of planetary companions (Pinte et al. 2018b; Teague et al. 2018, 2021a; Izquierdo et al. 2022). If there are planets in these disks, it has been shown that meridional flows of material (Fung & Chiang 2016) will be capable of disturbing the vertical density structure (Morbidelli et al. 2014; Szulágyi 2017; Szulágyi et al. 2022). Meridional flows have been detected observationally in HD 163296 (Teague et al. 2018); however, it is unclear if the modulations we detect in the vertical disk structure are related to the meridional flows, as simulations do not provide clear predictions on the vertical structure, for they are mainly focused on density and velocity perturbations. It is expected that the vertical profiles trace the location where the gas becomes optically thick; therefore, the modulations could also be related to density drops. However, as mentioned in Sect. 3.2.1, the locations of vertical modulations do not coincide with the gaps and rings in the integrated emission map of each molecule (Law et al. 2021a), which should be a direct proxy for density variations.
Another possibility could be that there are no real vertical modulations, but rather we are recovering artefacts as we assume that the emission maxima trace an isovelocity curve in a smooth disk, but in the sample there are perturbed channel maps (MWC 480 and HD 163296; Teague et al. 2021a). Alternatively, it could also be that the emitting layer is indeed perturbed and causing the channel map to appear perturbed due to projection effects. Future detailed studies on the effect of velocity perturbations in the extraction of emission surfaces will aid in breaking this degeneracy and understanding the observational characteristics of each effect. However, as we clearly recover the modulations at a constrained radial distance on both sides of the disk, with respect to the semi-minor axis and in all of the studied channels, we propose that they are real perturbations present in the vertical structure.
If the surface modulations are related to planetary companions in the disks, the feature at ~393 au in IM Lup is particularly relevant. It is a coherent, strong and well defined modulation present in 12CO and 13CO emission, with no kinematical feature associated with it. The radial location of this dip is close to where the gas component of the disk is expected to have a sharp change in the surface density (Panic et al. 2009). Searches for planetary companions in IM Lup have been performed (Mawet et al. 2012; Launhardt et al. 2020) but no object has been detected, considering a detection probability of ~30% for a planet of 13 MJ at 400 au. For MWC 480 and HD 163296 there are coherent inner modulations that are coincident with dust gaps, which for MWC 480 have no kinematical counterpart. However, for HD 163296 there is a strong linewidth residual at ~38 au and a positive velocity gradient at ~45 au (Teague et al. 2018; Izquierdo et al. 2022). Detailed models studying the effect of planetary companions on the CO emitting layer will be useful to determine if the detection of vertical features may be an indirect measure of the presence of a planet, but this goes beyond the scope of this paper.
5 Conclusions
In this work we have presented observational constraints on the vertical location of the molecular emission of seven disks. Using data of high angular and spectral resolution, we directly traced the emission location for up to ten different molecules. Our main findings and conclusions are the following:
We have characterized the emission surfaces of multiple molecules through a geometrical analysis of the channel map emission. We have also detected structured emission layers with modulations and spikes. Using an implementation of the Pinte et al. (2018a) method, where we mask the observed emission layer, we traced the emission surfaces at larger radii and for lower S/N molecular emission compared to previous work.
The derived emitting surfaces for CO isotopologues show a clear layering, with 12CO being the most vertically extended tracer. 13CO and C18O of the same transition trace similar regions. From our available data, we can also corroborate that lower transitions trace closer to the midplane than higher transitions in the case of 13CO, consistent with thermochemical models.
If the emission is optically thick and good approximations for the surface density and CO abundance are available, the 12CO emission surface can be used to obtain the gas pressure scale height of the disk. Our values indicate that the scale height is consistent with values of H/R = 0.1. These results were obtained using a simple analytical one-layer disk model, and initial testing with thermochemical DALI models indicates the method is robust, at least if the vertical material in the disk follows a Gaussian distribution.
The locations of the detected modulations in the CO isotopologue emitting surfaces are correlated to that of millimetre continuum gaps and kinematic perturbations. These modulations may be related to the presence of planetary companions or other mechanisms that cause variations in the gas density distribution.
HD 163296 shows a rich molecular reservoir from which most tracers can be located in distinct vertical regions. Overall, in our sample most of the molecular emission for tracers other than CO originates close to the midplane at z/r < 0.15. In the cases of HCO+ and H2CO, the observational constraints agree with theoretical predictions and constraints on the excitation temperature. Both molecules seem to be tracing the molecular layer above the CO freeze-out region. The particular morphology of the H2CO emitting surface may be the first direct indicator of this molecule originating from both ice grain desorption and gas phase chemistry.
HD 163296 displays CN and HCN in an intermediate vertical region. Their location is in agreement with theoretical predictions (e.g. Cazzoletti et al. 2018; Bergner et al. 2021) that HCN traces a layer just below CN. The rest of the systems in the MAPS sample show HCN very close to the midplane, and it is not possible to retrieve CN emission surfaces for a comparison. This is not expected from theoretical models. Future observations of higher CN transitions will allow us to compare our results on the location of HCN and better understand the disk radiation conditions.
This sample of disks and molecules represents the largest survey to date of the direct characterization of the emitting regions for multiple tracers. Dedicated physical-chemical modelling is crucial for understanding the diversity in the location of each molecule and how to relate the vertical profiles to actual disk properties.
We aim for this work to be used as a reference catalogue for future dedicated models on each of the sources so that the physical-chemical origin of each emission line can be adequately studied. With the sensitivity of instruments such as ALMA, we hope to enlarge the sample of disks where this kind of study is possible.
Acknowledgements
We thank the referee for the constructive comments. This paper makes use of the following ALMA data: #2015.1.00168.S, #2016.1.00484.L, #2016.1.00606.S, #2017.1.00069.S and #2018.1.01055.L. ALMA is a partnership of ESO (representing its member states), NSF (USA), and NINS (Japan), together with NRC (Canada), NSC and ASIAA (Taiwan), and KASI (Republic of Korea), in cooperation with the Republic of Chile. The Joint ALMA Observatory is operated by ESO, AUI/NRAO, and NAOJ. Astrochemistry in Leiden is supported by the Netherlands Research School for Astronomy (NOVA), and by funding from the European Research Council (ERC) under the European Union’s Horizon 2020 research and innovation programme (grant agreement No. 101019751 MOLDISK). B.T. is a Laureate of the Paris Region fellowship program, which is supported by the Ile-de-France Region and has received funding under the Horizon 2020 innovation framework program and Marie Sklodowska-Curie grant agreement No. 945298.
Appendix A WaOph 6 data and self-calibration
The emission lines studied in WaOph 6 are mostly observed by ALMA programme #2015.1.00168 (P.I. G. Blake). The data were obtained in two consecutive observations, performed on 28 June 2016, and the total integration time on source was 29 minutes. Table A.1 shows the information for all of the detected lines together with their integrated emission and imaging parameters after self-calibration. Besides the detected species, the spectral setup was also intended to observe H13CN J = 4 − 3 and SO3 7(8) − 6(9). We do not detect either of them even when using a natural weighting of the visibilities, at the achieved sensitivity level of 6mJy beam−1 (beam values for these tracers are ~0.4″). Of the detected lines, not all of them can be used to extract the emitting surfaces, due to low S/N, compact radial extent and lack of spatial resolution. Of this dataset only 12CO, 13CO and HCO+ have their emission surfaces extracted in the main text.
The data were initially calibrated the ALMA pipeline. Afterwards, phase and amplitude self-calibration were performed to enhance the signal to noise of the emission. To do this we use the tools found in the Common Astronomy Software Applications (CASA; McMullin et al. 2007), version 6.1.1.15. The self-calibration solutions were found using the line-subtracted continuum channels in all available spectral windows. Solutions for phase and amplitude were considered until the S/N improvement of the continuum was less than 2%. Four rounds of phase self-calibration were applied, using a maximum time interval of 965 seconds and dividing by two in each iteration to reach a minimum time interval of 120 seconds. After this, two rounds of amplitude self-calibrations were done, using a solution time interval of 965 and 480 seconds in each iteration. The overall peak signal to noise improvement was of 1300% in the continuum after completing self-calibration.
In the self-calibrated continuum data the centre of emission was found through a Gaussian fit in the image plane. The phase and pointing centres in the whole dataset were adjusted using CASA tasks FIXVIS and FIXPLANETS, respectively. The self-calibration solutions are then applied to the line emission channels and images of each line are produced using multi-scale TCLEAN and varying robust parameters to compromise between S/N and spatial resolution. Details on the robust and final full width half maximum beam values are found in Table A.1. In all cases a stopping threshold of 3σ is used to compute the image. The integrated emission (moment 0) maps and line spectra are shown in Fig. A.1.
Imaging and emission parameters for WaOph 6 data.
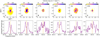 |
Fig. A.1 For each of the detected molecules in WaOph 6 from programme #2015.1.00168.S (P.I. G. Blake): the integrated emission maps (moment 0) with an emission cutoff at 3σ (top row) and the emission spectrum of each line (bottom row). The vertical orange line indicates the natural frequency of the molecule. |
Appendix B Data and best-fit parameters for the emitting layers
Appendix B.1 Data points and averaged vertical profiles
For each molecule and disk in the MAPS sample we present the extracted emission surfaces, showing all of the obtained data points in Figs. B.1, B.2, B.3, B.4, B.5, B.6, B.7, and B.8. The averaged vertical profiles and the best-fit parameters for each CO transition profile are shown in Fig. B.9 compared to those found using DISKSURF (Teague et al. 2021b) in Law et al. (2021b). In general, the surfaces are similar for 12CO; however, in 13CO and C18O the previous work underestimates the height of the emission compared to our results. This is particularly apparent beyond 200 au. The best-fit values for the emitting surfaces of all CO isotopologues, parameterized using an exponentially tapered power law can be found in Table B.1.
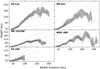 |
Fig. B.1 12CO J = 2−1 data points. |
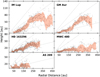 |
Fig. B.2 13CO J = 2 − 1 data points. |
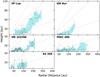 |
Fig. B.3 C180 J = 2 − 1 data points. |
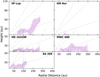 |
Fig. B.4 13CO J = 1 − 0 data points. |
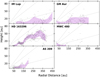 |
Fig. B.5 HCN data points. |
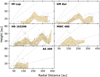 |
Fig. B.6 H2CO data points. |
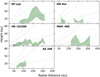 |
Fig. B.7 HCO+ data points. |
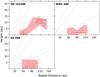 |
Fig. B.8 C2H data points. |
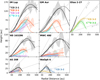 |
Fig. B.9 Best-fit vertical profiles of CO isotopologues (solid coloured lines) compared, when possible, to previously derived emission surfaces by Law et al. 2020b (dashed lines). Shaded background colours show the dispersion of the retrieved data. Solid grey lines indicate the curves of constant z/r for values of 0.1, 0.3, and 0.5. |
Best-fit parameters of vertical profiles for CO isotopologues.
Best-fit parameters of vertical profiles for other tracers in HD 163296.
Appendix B.2 Modulations in vertical surface
The modulations detected in the CO isotopologues for IM Lup, HD 163296 and MWC 480 are characterized as detailed in Sect. 3.2.1. Figures B.10, B.11, and B.12 display the baselines, averaged data and location of best-fit Gaussians for each disk and tracer analysed. The values of the best-fit location, width and depth of the vertical Gaussian components for each studied disk and isotopologue are shown in Table B.3.
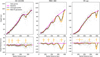 |
Fig. B.10 Data (grey dots), averaged profile (black curve), assumed baseline (pink profile), and best-fit Gaussians (orange line) obtained for each system from the analysis in Sect. 3.2.1 for 12CO. The bottom panels show the residuals obtained after subtracting the baseline profile from the data points. The vertical arrows mark the best-fit centre of each Gaussian component considered in each system. The horizontal line marks the width of the Gaussian component. |
Modulations in the CO vertical surface for HD 163296, MWC 480, and IM Lup.
Appendix C Tests and comparisons of the gas pressure scale height
Appendix C.1 Comparison scattering surfaces to CO and gas pressure scale height
From our simple one-layer model detailed in Sect. 3.2.3 we relate the location of the CO emission layer to that of the gas pressure scale height. This relation has a strong dependence on the surface density profile, CO abundance, and critical density. Figure C.1 shows the relation between these values. We note that the critical density value varies according to the optical depth (τ) at the emission location.
Figure C.2 shows the vertical location of the 12CO J = 2 − 1 emission layer, the parametrization of the scattering surface (Rich et al. 2021) and the inferred location of the gas pressure scale height obtained in this work. It is seen that for both IM Lup and HD 163296 the 12CO layer traces the most vertically extended region, followed by the scattering surface and closer to the midplane lies the gas pressure scale height.
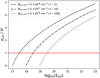 |
Fig. C.1 Conversion factor between the 12CO emitting surface (zCO) and the gas pressure scale height (H) as a function of the assumed CO density profile. This result is obtained by solving Eq. 5 and varying the critical density value for CO as indicated in the legend. |
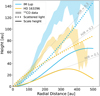 |
Fig. C.2 Location of the emission surface of 12CO J = 2−1 as extracted in this work, shown by the broad shaded regions for IM Lup (in blue) and HD 163296 (in yellow). Dotted lines indicate the scattering surfaces as parametrized in Rich et al. (2021), and solid coloured lines indicate the parametrization of the gas pressure scale height derived in this work. |
Appendix C.2 Conversion factors between zCO and H and an alternative estimate
Another method to estimate the pressure scale height is through the midplane temperature of the disk, calculated considering the luminosity of the star and then related to the scale height through the stellar mass (see Eqs. 3 and 4 from Law et al. 2022). This has been done for several disks with estimates on their CO emission layers, including the MAPS sample in Law et al. (2022). Figure C.3 shows the comparison of the radial conversion factors between zCO and H obtained through our single layer model and what is obtained from the pressure scale height derived through stellar parameters, assuming a flaring angle of 0.02. The conversion factors stretch between 3–5 in the inner 300 au and then to lower values in the outer radii for all of our sample. The curves shown in Fig. C.3 are smoother than those derived in Law et al. (2022) because we are using the best-fit parametrization of the CO emitting layer instead of the average height values. We note that, with the exception of AS 209, our method obtains a much narrower range for the conversion factor than when considering the stellar parameters. Through our test with thermochemical models we have confirmed the accuracy of our method, which implies that the method using stellar parameters is not a good approximation to the pressure scale height. The narrow range of our result suggests that there may be a direct relation, varying with radius, to convert the location of the CO emitting layer into gas pressure height. The difference in the conversion profile of AS 209 is due to the much lower density it has been reported to have (Zhang et al. 2021). Overall, these high resolution and sensitivity data open new avenues in our understanding of the disk physical structure.
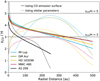 |
Fig. C.3 Comparison of the conversion factor between the 12CO emitting surface (zCO) and the gas pressure scale height (H) obtained through our simple single layer model (solid line) and using an estimate on the midplane temperature from the stellar parameters (dotted line). |
Appendix C.3 DALI model setups
An initial test on our simple analytical method to estimate the gas pressure scale height is done through thermochemical DALI (Bruderer 2013; Bruderer et al. 2012) models. For details on the code, how the chemical network is set and the calculation of the temperature structure, dust populations and flux values we reference to past works using the same code (e.g. Leemker et al. 2022; Miotello et al. 2016; Bruderer et al. 2012; Bruderer 2013). We use the chemical network of Bruderer et al. (2012) and consider a chemical age of 1 Myr for the calculations. Other general parameters common to all simulations are presented in Table C.1.
The aim of these models is to create a structure using the best-fit gas surface density values reported in Zhang et al. (2021) for each of the MAPS sources (see Table 2 in Zhang et al. 2021). The radial structure of the gas and dust in DALI follows the self-similar solution to a viscously evolving disk (Lynden-Bell & Pringle 1974; Andrews et al. 2011):
![$ \Sigma \left( R \right) = {\Sigma _c}{\left( {{R \over {{R_c}}}} \right)^{ - \gamma }}\exp \left[ { - {{\left( {{R \over {{R_c}}}} \right)}^{2 - \gamma }}} \right], $](/articles/aa/full_html/2023/01/aa44428-22/aa44428-22-eq104.png) (C.1)
(C.1)
where Rc is the characteristic radius and γ the surface density exponent. The vertical structure of the disk follows a Gaussian distribution, which we have modified from the typical DALI prescription (see for example Leemker et al. 2022) to match the prescription of Zhang et al. (2021). The scale height angle (h) is set at each radius following
 (C.2)
(C.2)
where h100 is the scale height angle at 100 au. The scale height angle can be converted to a physical height above the disk mid-plane, H as H ~ hR. We note that as the scale height is defined in angular units, the flaring angle φ will be 1 − φr, where φr is the flaring angle for a model in physical units (as presented in Zhang et al. 2021). The physical and stellar parameters used for each disk are shown in Table C.3. Using the radiative transfer tools of DALI (Bruderer 2013; Bruderer et al. 2012), we create mock channel maps from each model matching the velocity (0.2 km s−1) and spatial (0.13″) resolution of the 12CO observations. These channel maps are analysed using ALFAHOR in the same way as the observations (see Sect. 2.2.1) to extract the emitting layer.
Using the DALI models we additionally test if the inclination of the system may affect on our retrieval of the vertical surface. Figure C.4 shows the retrieved vertical profiles for 12CO J = 2 − 1 from the GM Aur model using three different inclinations to compute the channel maps. As can be seen, there is no significant variation between the inclinations, indicating that, at least for optically thick tracers, the orientation of the disk is not a source of concern. What may vary at different inclinations is the radial extent up to which it is possible to confidently separate and trace far and near surfaces in the channels. This leads to a difference in the maximum radial region in which we can trace the vertical structure, but, within a radial extent that is sampled by all inclinations, the vertical profiles are in agreement. Further testing with the models of the other studied systems show the same results of coherent values at different inclinations. IM Lup is the disk that shows the largest variations; however, the values are still very similar within the uncertainties. As discussed in Sect. 3.2.3 the surface density model of IM Lup considers the most massive and extended disk of the sample and this could be related to tracing a lower vertical layer and slight differences with varying inclinations. This will be studied in detail in future work focused on thermochemical models.
Common parameters in DALI models.
Physical parameters for DALI models.
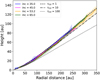 |
Fig. C.4 Extracted vertical profiles for 12CO J = 2 − 1 obtained using mock channel maps at different inclinations, from the GM Aur DALI model. Different colours trace the various inclinations, and the black lines indicate the 12CO millimetre optical depth values, as done in Fig. 8. |
References
- Aikawa, Y., & Herbst, E. 1999, A&A, 351, 233 [NASA ADS] [Google Scholar]
- Aikawa, Y., van Zadelhoff, G. J., van Dishoeck, E. F., & Herbst, E. 2002, A&A, 386, 622 [NASA ADS] [CrossRef] [EDP Sciences] [Google Scholar]
- Aikawa, Y., Cataldi, G., Yamato, Y., et al. 2021, ApJS, 257, 13 [NASA ADS] [CrossRef] [Google Scholar]
- Andrews, S. M., Wilner, D. J., Espaillat, C., et al. 2011, ApJ, 732, 42 [Google Scholar]
- Andrews, S. M., Huang, J., Pérez, L. M., et al. 2018, ApJ, 869, L41 [NASA ADS] [CrossRef] [Google Scholar]
- Armitage, P. J. 2015, ArXiv e-prints [arXiv: 1509.06382] [Google Scholar]
- Avenhaus, H., Quanz, S. P., Garufi, A., et al. 2018, ApJ, 863, 44 [NASA ADS] [CrossRef] [Google Scholar]
- Bell, K. R., Cassen, P. M., Klahr, H. H., & Henning, T. 1997, ApJ, 486, 372 [NASA ADS] [CrossRef] [Google Scholar]
- Bergner, J. B., Öberg, K. I., Guzmán, V. V., et al. 2021, ApJS, 257, 11 [NASA ADS] [CrossRef] [Google Scholar]
- Bruderer, S. 2013, A&A, 559, A46 [NASA ADS] [CrossRef] [EDP Sciences] [Google Scholar]
- Bruderer, S., van Dishoeck, E. F., Doty, S. D., & Herczeg, G. J. 2012, A&A, 541, A91 [NASA ADS] [CrossRef] [EDP Sciences] [Google Scholar]
- Carney, M. T., Hogerheijde, M. R., Loomis, R. A., et al. 2017, A&A, 605, A21 [NASA ADS] [CrossRef] [EDP Sciences] [Google Scholar]
- Cazzoletti, P., van Dishoeck, E. F., Visser, R., Facchini, S., & Bruderer, S. 2018, A&A, 609, A93 [NASA ADS] [CrossRef] [EDP Sciences] [Google Scholar]
- Chiang, E. I., & Goldreich, P. 1997, ApJ, 490, 368 [Google Scholar]
- Chiang, E. I., Joung, M. K., Creech-Eakman, M. J., et al. 2001, ApJ, 547, 1077 [NASA ADS] [CrossRef] [Google Scholar]
- Cleeves, L. I., Öberg, K. I., Wilner, D. J., et al. 2018, ApJ, 865, 155 [Google Scholar]
- Czekala, I., Loomis, R. A., Teague, R., et al. 2021, ApJS, 257, 2 [NASA ADS] [CrossRef] [Google Scholar]
- D’Alessio, P., Cantö, J., Calvet, N., & Lizano, S. 1998, ApJ, 500, 411 [Google Scholar]
- Dartois, E., Dutrey, A., & Guilloteau, S. 2003, A&A, 399, 773 [CrossRef] [EDP Sciences] [Google Scholar]
- Dullemond, C. P., van Zadelhoff, G. J., & Natta, A. 2002, A&A, 389, 464 [NASA ADS] [CrossRef] [EDP Sciences] [Google Scholar]
- Flores, C., Duchêne, G., Wolff, S., et al. 2021, AJ, 161, 239 [NASA ADS] [CrossRef] [Google Scholar]
- Fogel, J. K. J., Bethell, T. J., Bergin, E. A., Calvet, N., & Semenov, D. 2011, ApJ, 726, 29 [NASA ADS] [CrossRef] [Google Scholar]
- Foreman-Mackey, D., Farr, W., Sinha, M., et al. 2019, J. Open Source Softw., 4, 1864 [NASA ADS] [CrossRef] [Google Scholar]
- Fuchs, G. W., Cuppen, H. M., Ioppolo, S., et al. 2009, A&A, 505, 629 [NASA ADS] [CrossRef] [EDP Sciences] [Google Scholar]
- Fung, J., & Chiang, E. 2016, ApJ, 832, 105 [NASA ADS] [CrossRef] [Google Scholar]
- Ginski, C., Stolker, T., Pinilla, P., et al. 2016, A&A, 595, A112 [NASA ADS] [CrossRef] [EDP Sciences] [Google Scholar]
- Guzmán, V. V., Bergner, J. B., Law, C. J., et al. 2021, ApJS, 257, 6 [CrossRef] [Google Scholar]
- Hennebelle, P., Lesur, G., & Fromang, S. 2017, A&A, 599, A86 [NASA ADS] [CrossRef] [EDP Sciences] [Google Scholar]
- Hiraoka, K., Ohashi, N., Kihara, Y., et al. 1994, Chem. Phys. Lett., 229, 408 [Google Scholar]
- Huang, J., Andrews, S. M., Dullemond, C. P., et al. 2018a, ApJ, 869, L42 [NASA ADS] [CrossRef] [Google Scholar]
- Huang, J., Andrews, S. M., Pérez, L. M., et al. 2018b, ApJ, 869, L43 [Google Scholar]
- Huang, J., Bergin, E. A., Öberg, K. I., et al. 2021, ApJS, 257, 19 [NASA ADS] [CrossRef] [Google Scholar]
- Ilee, J. D., Walsh, C., Booth, A. S., et al. 2021, ApJS, 257, 9 [NASA ADS] [CrossRef] [Google Scholar]
- Izquierdo, A. F., Testi, L., Facchini, S., Rosotti, G. P., & van Dishoeck, E. F. 2021, A&A, 650, A179 [NASA ADS] [CrossRef] [EDP Sciences] [Google Scholar]
- Izquierdo, A. F., Facchini, S., Rosotti, G. P., van Dishoeck, E. F., & Testi, L. 2022, ApJ, 928, 2 [NASA ADS] [CrossRef] [Google Scholar]
- Jorsater, S., & van Moorsel, G. A. 1995, AJ, 110, 2037 [Google Scholar]
- Lacy, J. H., Knacke, R., Geballe, T. R., & Tokunaga, A. T. 1994, ApJ, 428, L69 [CrossRef] [Google Scholar]
- Launhardt, R., Henning, T., Quirrenbach, A., et al. 2020, A&A, 635, A162 [NASA ADS] [CrossRef] [EDP Sciences] [Google Scholar]
- Law, C. J., Loomis, R. A., Teague, R., et al. 2021a, ApJS, 257, 3 [NASA ADS] [CrossRef] [Google Scholar]
- Law, C. J., Teague, R., Loomis, R. A., et al. 2021b, ApJS, 257, 4 [NASA ADS] [CrossRef] [Google Scholar]
- Law, C. J., Crystian, S., Teague, R., et al. 2022, ApJ, 932, 114 [NASA ADS] [CrossRef] [Google Scholar]
- Leemker, M., Booth, A. S., van Dishoeck, E. F., et al. 2022, A&A, 663, A23 [NASA ADS] [CrossRef] [EDP Sciences] [Google Scholar]
- Lodato, G., Dipierro, G., Ragusa, E., et al. 2019, MNRAS, 486, 453 [Google Scholar]
- Loomis, R. A., Cleeves, L. I., Öberg, K. I., Guzman, V. V., & Andrews, S. M. 2015, ApJ, 809, L25 [Google Scholar]
- Lynden-Bell, D., & Pringle, J. E. 1974, MNRAS, 168, 603 [Google Scholar]
- Mawet, D., Absil, O., Montagnier, G., et al. 2012, A&A, 544, A131 [NASA ADS] [CrossRef] [EDP Sciences] [Google Scholar]
- McMullin, J. P., Waters, B., Schiebel, D., Young, W., & Golap, K. 2007, ASP Conf. Ser., 376, 127 [Google Scholar]
- Miotello, A., Bruderer, S., & van Dishoeck, E. F. 2014, A&A, 572, A96 [NASA ADS] [CrossRef] [EDP Sciences] [Google Scholar]
- Miotello, A., van Dishoeck, E. F., Kama, M., & Bruderer, S. 2016, A&A, 594, A85 [NASA ADS] [CrossRef] [EDP Sciences] [Google Scholar]
- Miotello, A., Facchini, S., van Dishoeck, E. F., et al. 2019, A&A, 631, A69 [NASA ADS] [CrossRef] [EDP Sciences] [Google Scholar]
- Morbidelli, A., Szulágyi, J., Crida, A., et al. 2014, Icarus, 232, 266 [Google Scholar]
- Nealon, R., Pinte, C., Alexander, R., Mentiplay, D., & Dipierro, G. 2019, MNRAS, 484, 4951 [CrossRef] [Google Scholar]
- Öberg, K. I., Guzmán, V. V., Walsh, C., et al. 2021, ApJS, 257, 1 [CrossRef] [Google Scholar]
- Paneque-Carreño, T., Pérez, L. M., Benisty, M., et al. 2021, ApJ, 914, 88 [CrossRef] [Google Scholar]
- Paneque-Carreño, T., Miotello, A., van Dishoeck, E. F., et al. 2022, A&A, 666, A168 [NASA ADS] [CrossRef] [EDP Sciences] [Google Scholar]
- Panic, O., Hogerheijde, M. R., Wilner, D., & Qi, C. 2009, A&A, 501, 269 [NASA ADS] [CrossRef] [EDP Sciences] [Google Scholar]
- Pegues, J., Öberg, K. I., Bergner, J. B., et al. 2020, ApJ, 890, 142 7 [Google Scholar]
- Pérez, L. M., Carpenter, J. M., Andrews, S. M., et al. 2016, Science, 353, 1519 [Google Scholar]
- Pérez, S., Casassus, S., & Benítez-Llambay, P. 2018, MNRAS, 480, L12 [Google Scholar]
- Pinte, C., Ménard, F., Duchêne, G., et al. 2018a, A&A, 609, A47 [NASA ADS] [CrossRef] [EDP Sciences] [Google Scholar]
- Pinte, C., Price, D. J., Ménard, F., et al. 2018b, ApJ, 860, L13 [Google Scholar]
- Podio, L., Garufi, A., Codella, C., et al. 2020, A&A, 642, L7 [NASA ADS] [CrossRef] [EDP Sciences] [Google Scholar]
- Rich, E. A., Teague, R., Monnier, J. D., et al. 2021, ApJ, 913, 138 [NASA ADS] [CrossRef] [Google Scholar]
- Rosenfeld, K. A., Andrews, S. M., Hughes, A. M., Wilner, D. J., & Qi, C. 2013, ApJ, 774, 16 [Google Scholar]
- Ruíz-Rodríguez, D., Kastner, J., Hily-Blant, P., & Forveille, T. 2021, A&A, 646, A59 [NASA ADS] [CrossRef] [EDP Sciences] [Google Scholar]
- Szulágyi, J. 2017, ApJ, 842, 103 [Google Scholar]
- Szulágyi, J., Binkert, F., & Surville, C. 2022, ApJ, 924, 1 [CrossRef] [Google Scholar]
- Teague, R. 2019, J. Open Source Softw., 4, 1632 [NASA ADS] [CrossRef] [Google Scholar]
- Teague, R., & Loomis, R. 2020, ApJ, 899, 157 [Google Scholar]
- Teague, R., Bae, J., Bergin, E. A., Birnstiel, T., & Foreman-Mackey, D. 2018, ApJ, 860, L12 [NASA ADS] [CrossRef] [Google Scholar]
- Teague, R., Bae, J., Aikawa, Y., et al. 2021a, ApJS, 257, 18 [NASA ADS] [CrossRef] [Google Scholar]
- Teague, R., Law, C., Huang, J., & Meng, F. 2021b, J. Open Source Softw., 6, 3827 [NASA ADS] [CrossRef] [Google Scholar]
- Terwisscha van Scheltinga, J., Hogerheijde, M. R., Cleeves, L. I., et al. 2021, ApJ, 906, 111 [Google Scholar]
- van der Tak, F. F. S., Black, J. H., Schöier, F. L., Jansen, D. J., & van Dishoeck, E. F. 2007, A&A, 468, 627 [NASA ADS] [CrossRef] [EDP Sciences] [Google Scholar]
- van Zadelhoff, G. J., van Dishoeck, E. F., Thi, W. F., & Blake, G. A. 2001, A&A, 377, 566 [NASA ADS] [CrossRef] [EDP Sciences] [Google Scholar]
- van Zadelhoff, G. J., Aikawa, Y., Hogerheijde, M. R., & van Dishoeck, E. F. 2003, A&A, 397, 789 [CrossRef] [EDP Sciences] [Google Scholar]
- van’t Hoff, M. L. R., Harsono, D., Tobin, J. J., et al. 2020, ApJ, 901, 166 [Google Scholar]
- Veronesi, B., Paneque-Carreño, T., Lodato, G., et al. 2021, ApJ, 914, L27 [NASA ADS] [CrossRef] [Google Scholar]
- Villenave, M., Ménard, F., Dent, W. R. F., et al. 2020, A&A, 642, A164 [EDP Sciences] [Google Scholar]
- Visser, R., Bruderer, S., Cazzoletti, P., et al. 2018, A&A, 615, A75 [NASA ADS] [CrossRef] [EDP Sciences] [Google Scholar]
- Walsh, C., Millar, T. J., & Nomura, H. 2010, ApJ, 722, 1607 [Google Scholar]
- Woitke, P., Min, M., Pinte, C., et al. 2016, A&A, 586, A103 [NASA ADS] [CrossRef] [EDP Sciences] [Google Scholar]
- Zhang, K., Booth, A. S., Law, C. J., et al. 2021, ApJS, 257, 5 [NASA ADS] [CrossRef] [Google Scholar]
A repository with the mask and code developed for this study can be found at https://github.com/teresapaz/alfahor
All Tables
All Figures
|
Fig. 1 Rotated 7.86 km s−1 channel map emission of the J = 2−1 transition of CO isotopologues in HD 163296. Overlaid are the regions masked as far and near sides of the upper surface in dashed and solid black lines, respectively. White dots trace the emission maxima within the masked regions. |
| In the text | |
|
Fig. 2 For HD 163296, vertical emission profiles (left panel) and azimuthally averaged peak brightness temperature profiles (right panel) for various tracers, beyond CO isotopologues. Solid coloured lines show the mean value in each profile and shaded regions the 1σ data dispersion. The vertical blue lines in the right panel indicate the location of the millimetre continuum gaps and the ring detected by Huang et al. (2018a). |
| In the text | |
|
Fig. 3 Vertical profiles for CO isotopologues as extracted from the channel maps of each disk. The shaded region shows the dispersion of the data points, and the solid coloured line traces the average values within each radial bin. Note that Elias 2-27 and WaOph 6 were observed at a higher transition (J = 3−2) in some CO isotopologues. Solid grey lines show a constant z/r of 0.1, 0.3, and 0.5. Each row has a different vertical extent. |
| In the text | |
|
Fig. 4 Example of baseline and best-fit Gaussian modulation extraction for the MWC 480 12CO dataset. |
| In the text | |
|
Fig. 5 Data corresponding to 12CO J = 2−1 (in black) and 13CO J =2−1 (in orange) for three disks where modulations in the vertical surface are detected. Coloured dots indicate the extracted data from the channel maps for each tracer. Continuous lines trace the best-fit surface considering the reference baseline and a number of fitted Gaussians. The location and width of the Gaussians for each molecule are signaled at the top of each panel. Vertical blue lines trace the dust structure from Huang et al. (2018a). Vertical green lines show the reported kinematic residuals from Teague et al. (2021a) and Izquierdo et al. (2022). |
| In the text | |
|
Fig. 6 Brightness temperature profiles of the CO isotopologue emission in each disk. The solid line indicates the mean value and the shaded region the standard deviation within each radial bin, divided by the number of beams in each annulus. The vertical and radial scales are the same in each panel. Dashed vertical lines in IM Lup, HD 163296, and MWC 480 indicate the location of the vertical modulations determined in this work for 12CO. |
| In the text | |
|
Fig. 7 Derived gas pressure scale height (H) for each of the disks in the MAPS sample (in solid coloured lines) from our analysis of the 12CO emitting surface. Dashed lines show the predicted scale height for each disk from Zhang et al. (2021). Solid grey lines show the location of constant H/R at 0.1 and 0.2. |
| In the text | |
|
Fig. 8 Results on the vertical location for 12CO (pink line) and the inferred pressure scale height (blue line). The 12CO vertical location is obtained with ALFAHOR through the analysis of mock channel maps generated from a DALI model that uses the surface density prescription from Zhang et al. (2021) for each disk. Points extracted from the synthetic channel maps are shown in grey for comparison with the average value (zCO). The inferred pressure scale height is calculated following Eq. (5). The pressure scale height used as input for the DALI models (H) is shown for comparison (yellow line). Dashed, dot-dashed, and dotted lines show the model location of the CO millimetre optical depths (τCO) 1, 10, and 100, respectively. |
| In the text | |
|
Fig. 9 Vertical profiles of the emission surface for molecules other than CO isotopologues in the studied disks. Elias 2-27 is not shown due to a lack of data in other tracers. Black curves show the location of the CO isotopologues in the J = 2−1 transition for reference. The solid line is 12CO, the dashed line 13CO, and the dotted line C18O. Each coloured curve shows a different tracer, where the solid line is the mean value and the shaded region shows the dispersion of the retrieved data points within each radial bin. Grey lines mark a constant z/r of 0.1, 0.3, and 0.5. |
| In the text | |
|
Fig. 10 Average z/r values of each tracer and disk under study. To avoid the effect of the turnover in the case of vertically extended molecules, only data within 80% of the 13CO (or 12CO for MWC 480 and AS 209) rtaper is considered. Note that for Elias 2-27, CN is a higher transition (N = 3−2) than the CN shown in HD 163296 (N = 1−0). |
| In the text | |
|
Fig. 11 Vertical surface profiles for HCN (top row) and H2CO (bottom row). The green vertical line marks the edge of the dust continuum as reported in Law et al. (2020a). The solid and dashed lines in each panel mark the rings and gaps, respectively, found in the emission maps of each molecule from Law et al. (2020a). In the profiles, the solid line marks the mean value and the grey shaded area the dispersion of the retrieved data points in each radial bin. |
| In the text | |
|
Fig. A.1 For each of the detected molecules in WaOph 6 from programme #2015.1.00168.S (P.I. G. Blake): the integrated emission maps (moment 0) with an emission cutoff at 3σ (top row) and the emission spectrum of each line (bottom row). The vertical orange line indicates the natural frequency of the molecule. |
| In the text | |
|
Fig. B.1 12CO J = 2−1 data points. |
| In the text | |
|
Fig. B.2 13CO J = 2 − 1 data points. |
| In the text | |
|
Fig. B.3 C180 J = 2 − 1 data points. |
| In the text | |
|
Fig. B.4 13CO J = 1 − 0 data points. |
| In the text | |
|
Fig. B.5 HCN data points. |
| In the text | |
|
Fig. B.6 H2CO data points. |
| In the text | |
|
Fig. B.7 HCO+ data points. |
| In the text | |
|
Fig. B.8 C2H data points. |
| In the text | |
|
Fig. B.9 Best-fit vertical profiles of CO isotopologues (solid coloured lines) compared, when possible, to previously derived emission surfaces by Law et al. 2020b (dashed lines). Shaded background colours show the dispersion of the retrieved data. Solid grey lines indicate the curves of constant z/r for values of 0.1, 0.3, and 0.5. |
| In the text | |
|
Fig. B.10 Data (grey dots), averaged profile (black curve), assumed baseline (pink profile), and best-fit Gaussians (orange line) obtained for each system from the analysis in Sect. 3.2.1 for 12CO. The bottom panels show the residuals obtained after subtracting the baseline profile from the data points. The vertical arrows mark the best-fit centre of each Gaussian component considered in each system. The horizontal line marks the width of the Gaussian component. |
| In the text | |
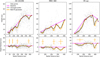 |
Fig. B.11 Same as Fig. B.10 but for 13CO. |
| In the text | |
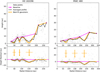 |
Fig. B.12 Same as Fig. B.10 but for C18O. |
| In the text | |
|
Fig. C.1 Conversion factor between the 12CO emitting surface (zCO) and the gas pressure scale height (H) as a function of the assumed CO density profile. This result is obtained by solving Eq. 5 and varying the critical density value for CO as indicated in the legend. |
| In the text | |
|
Fig. C.2 Location of the emission surface of 12CO J = 2−1 as extracted in this work, shown by the broad shaded regions for IM Lup (in blue) and HD 163296 (in yellow). Dotted lines indicate the scattering surfaces as parametrized in Rich et al. (2021), and solid coloured lines indicate the parametrization of the gas pressure scale height derived in this work. |
| In the text | |
|
Fig. C.3 Comparison of the conversion factor between the 12CO emitting surface (zCO) and the gas pressure scale height (H) obtained through our simple single layer model (solid line) and using an estimate on the midplane temperature from the stellar parameters (dotted line). |
| In the text | |
|
Fig. C.4 Extracted vertical profiles for 12CO J = 2 − 1 obtained using mock channel maps at different inclinations, from the GM Aur DALI model. Different colours trace the various inclinations, and the black lines indicate the 12CO millimetre optical depth values, as done in Fig. 8. |
| In the text | |
Current usage metrics show cumulative count of Article Views (full-text article views including HTML views, PDF and ePub downloads, according to the available data) and Abstracts Views on Vision4Press platform.
Data correspond to usage on the plateform after 2015. The current usage metrics is available 48-96 hours after online publication and is updated daily on week days.
Initial download of the metrics may take a while.