Fig. 11
Download original image
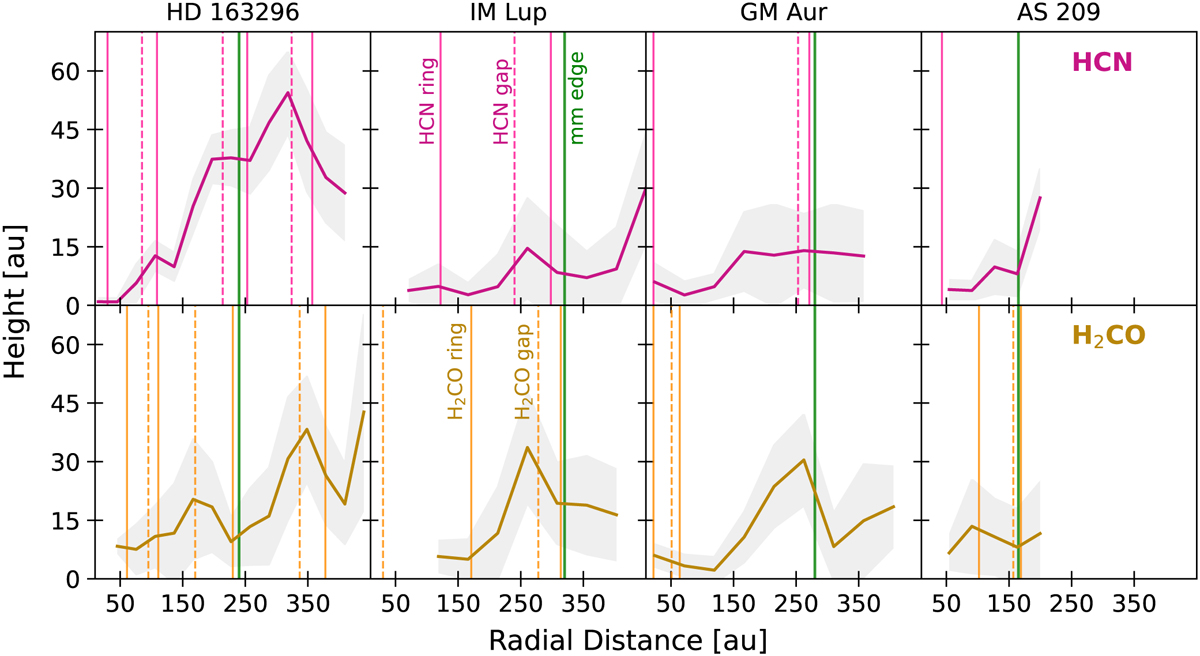
Vertical surface profiles for HCN (top row) and H2CO (bottom row). The green vertical line marks the edge of the dust continuum as reported in Law et al. (2020a). The solid and dashed lines in each panel mark the rings and gaps, respectively, found in the emission maps of each molecule from Law et al. (2020a). In the profiles, the solid line marks the mean value and the grey shaded area the dispersion of the retrieved data points in each radial bin.
Current usage metrics show cumulative count of Article Views (full-text article views including HTML views, PDF and ePub downloads, according to the available data) and Abstracts Views on Vision4Press platform.
Data correspond to usage on the plateform after 2015. The current usage metrics is available 48-96 hours after online publication and is updated daily on week days.
Initial download of the metrics may take a while.