Open Access
Fig. B.9
Download original image
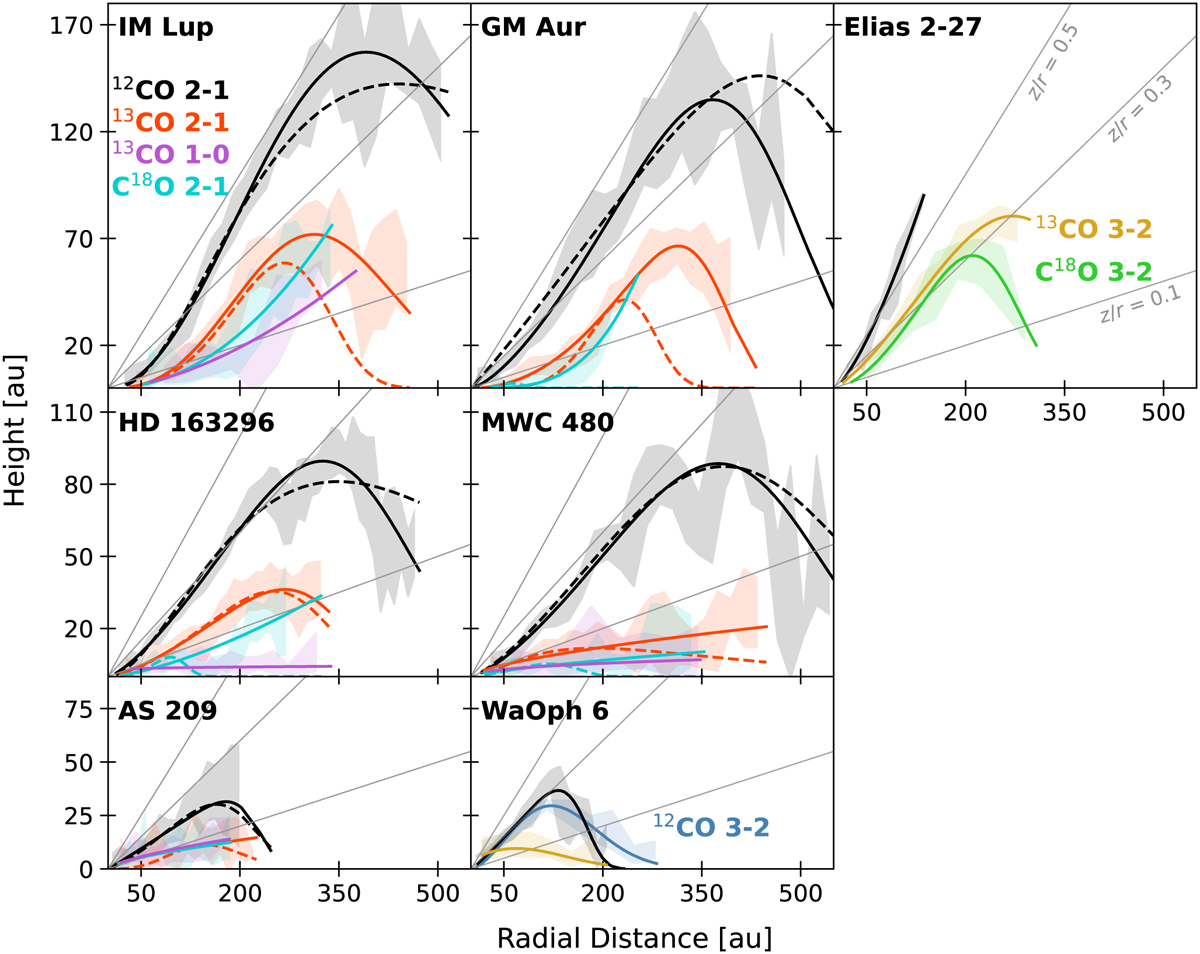
Best-fit vertical profiles of CO isotopologues (solid coloured lines) compared, when possible, to previously derived emission surfaces by Law et al. 2020b (dashed lines). Shaded background colours show the dispersion of the retrieved data. Solid grey lines indicate the curves of constant z/r for values of 0.1, 0.3, and 0.5.
Current usage metrics show cumulative count of Article Views (full-text article views including HTML views, PDF and ePub downloads, according to the available data) and Abstracts Views on Vision4Press platform.
Data correspond to usage on the plateform after 2015. The current usage metrics is available 48-96 hours after online publication and is updated daily on week days.
Initial download of the metrics may take a while.