Fig. 6
Download original image
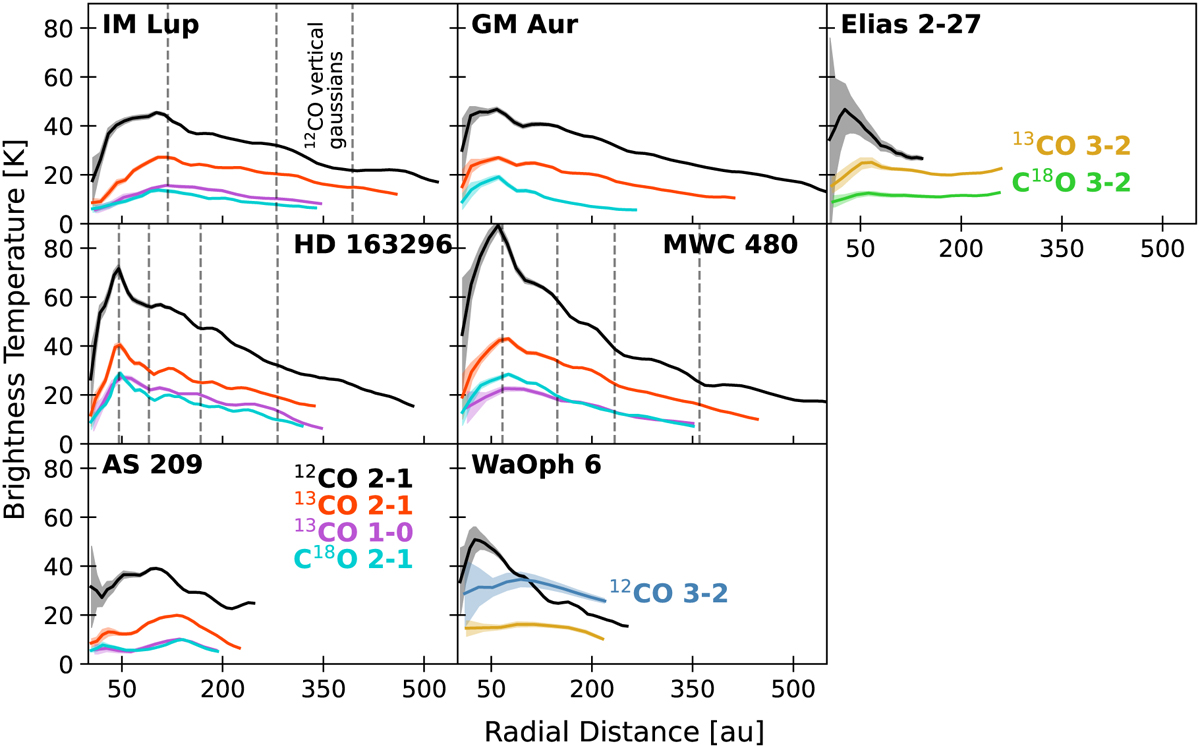
Brightness temperature profiles of the CO isotopologue emission in each disk. The solid line indicates the mean value and the shaded region the standard deviation within each radial bin, divided by the number of beams in each annulus. The vertical and radial scales are the same in each panel. Dashed vertical lines in IM Lup, HD 163296, and MWC 480 indicate the location of the vertical modulations determined in this work for 12CO.
Current usage metrics show cumulative count of Article Views (full-text article views including HTML views, PDF and ePub downloads, according to the available data) and Abstracts Views on Vision4Press platform.
Data correspond to usage on the plateform after 2015. The current usage metrics is available 48-96 hours after online publication and is updated daily on week days.
Initial download of the metrics may take a while.