Open Access
Fig. 7
Download original image
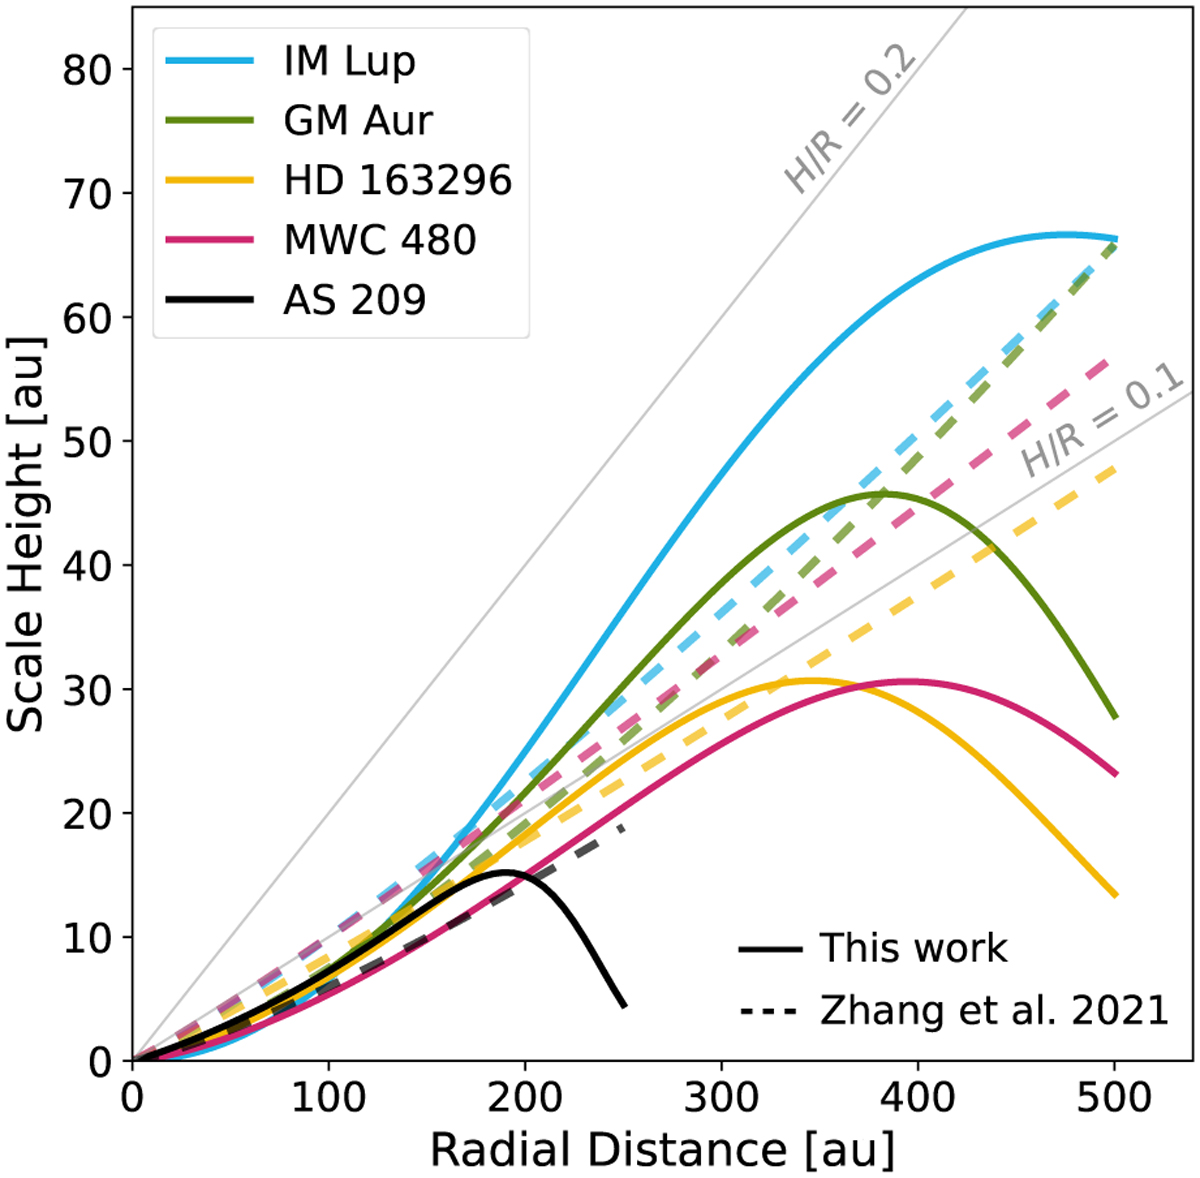
Derived gas pressure scale height (H) for each of the disks in the MAPS sample (in solid coloured lines) from our analysis of the 12CO emitting surface. Dashed lines show the predicted scale height for each disk from Zhang et al. (2021). Solid grey lines show the location of constant H/R at 0.1 and 0.2.
Current usage metrics show cumulative count of Article Views (full-text article views including HTML views, PDF and ePub downloads, according to the available data) and Abstracts Views on Vision4Press platform.
Data correspond to usage on the plateform after 2015. The current usage metrics is available 48-96 hours after online publication and is updated daily on week days.
Initial download of the metrics may take a while.