Fig. 2
Download original image
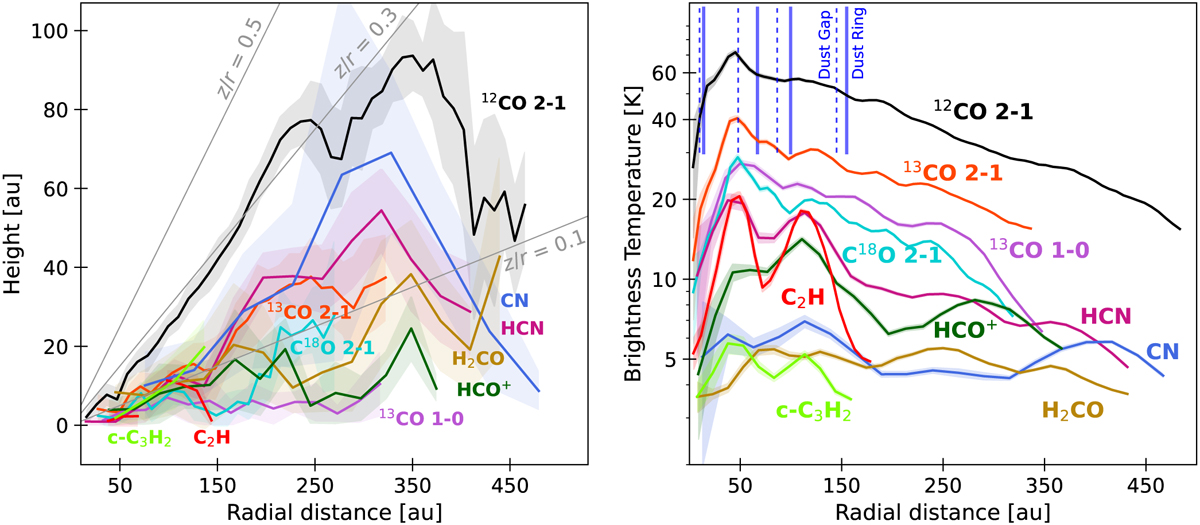
For HD 163296, vertical emission profiles (left panel) and azimuthally averaged peak brightness temperature profiles (right panel) for various tracers, beyond CO isotopologues. Solid coloured lines show the mean value in each profile and shaded regions the 1σ data dispersion. The vertical blue lines in the right panel indicate the location of the millimetre continuum gaps and the ring detected by Huang et al. (2018a).
Current usage metrics show cumulative count of Article Views (full-text article views including HTML views, PDF and ePub downloads, according to the available data) and Abstracts Views on Vision4Press platform.
Data correspond to usage on the plateform after 2015. The current usage metrics is available 48-96 hours after online publication and is updated daily on week days.
Initial download of the metrics may take a while.