Fig. 3
Download original image
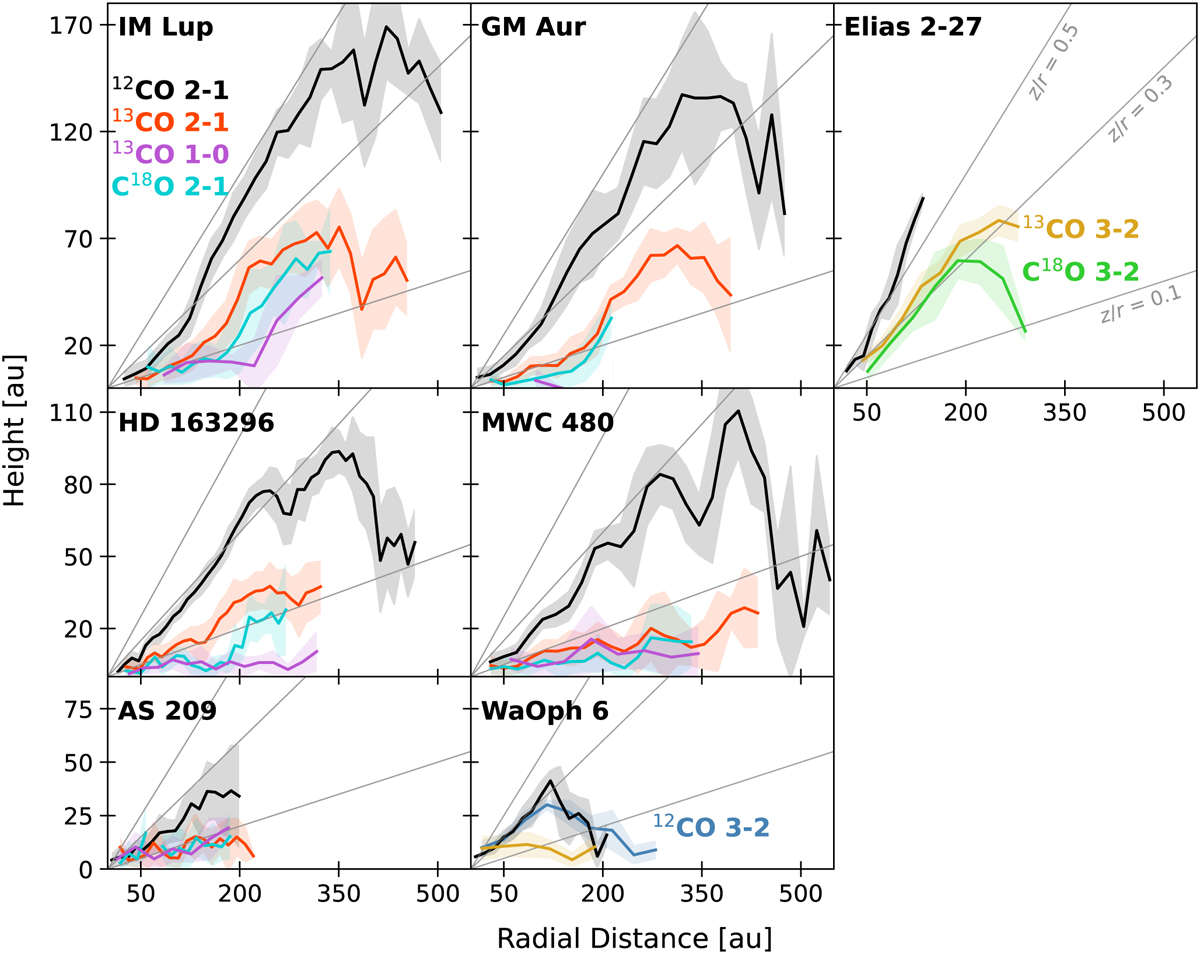
Vertical profiles for CO isotopologues as extracted from the channel maps of each disk. The shaded region shows the dispersion of the data points, and the solid coloured line traces the average values within each radial bin. Note that Elias 2-27 and WaOph 6 were observed at a higher transition (J = 3−2) in some CO isotopologues. Solid grey lines show a constant z/r of 0.1, 0.3, and 0.5. Each row has a different vertical extent.
Current usage metrics show cumulative count of Article Views (full-text article views including HTML views, PDF and ePub downloads, according to the available data) and Abstracts Views on Vision4Press platform.
Data correspond to usage on the plateform after 2015. The current usage metrics is available 48-96 hours after online publication and is updated daily on week days.
Initial download of the metrics may take a while.