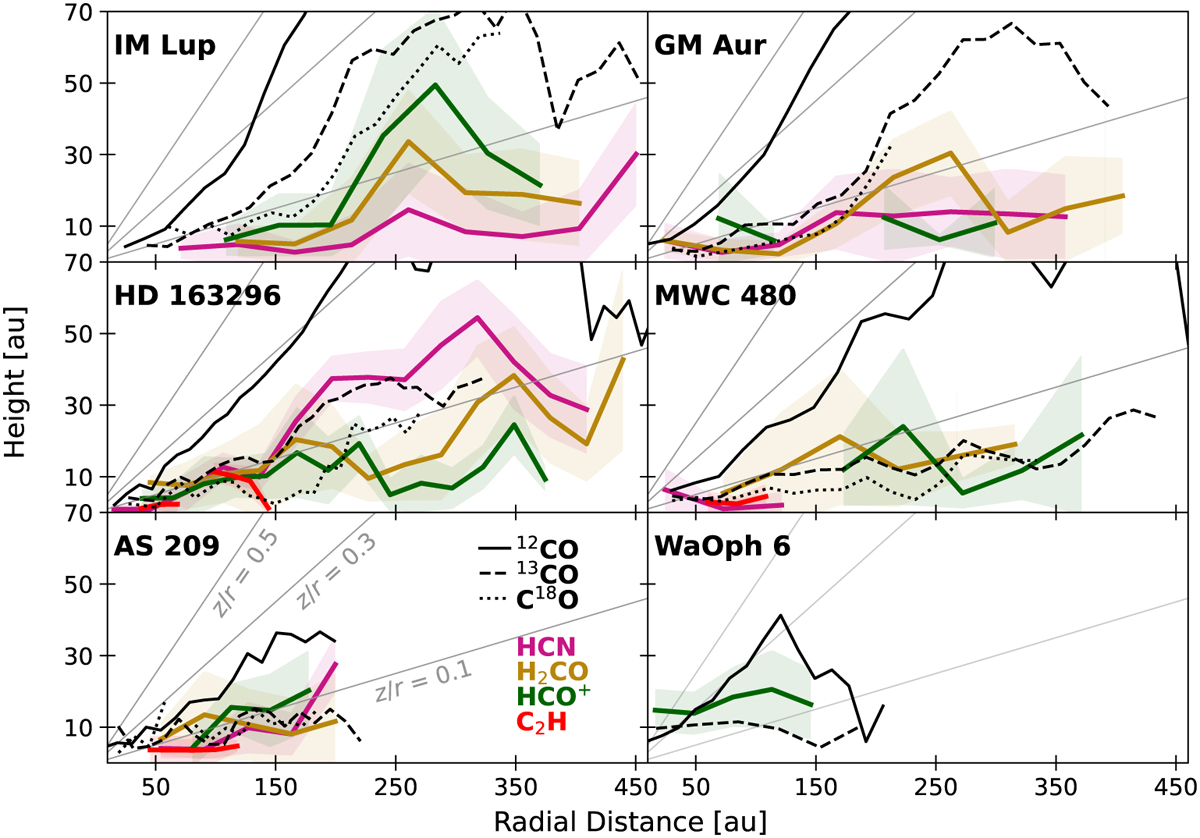
Fig. 9
Download original image
Vertical profiles of the emission surface for molecules other than CO isotopologues in the studied disks. Elias 2-27 is not shown due to a lack of data in other tracers. Black curves show the location of the CO isotopologues in the J = 2−1 transition for reference. The solid line is 12CO, the dashed line 13CO, and the dotted line C18O. Each coloured curve shows a different tracer, where the solid line is the mean value and the shaded region shows the dispersion of the retrieved data points within each radial bin. Grey lines mark a constant z/r of 0.1, 0.3, and 0.5.
Current usage metrics show cumulative count of Article Views (full-text article views including HTML views, PDF and ePub downloads, according to the available data) and Abstracts Views on Vision4Press platform.
Data correspond to usage on the plateform after 2015. The current usage metrics is available 48-96 hours after online publication and is updated daily on week days.
Initial download of the metrics may take a while.