Fig. 8
Download original image
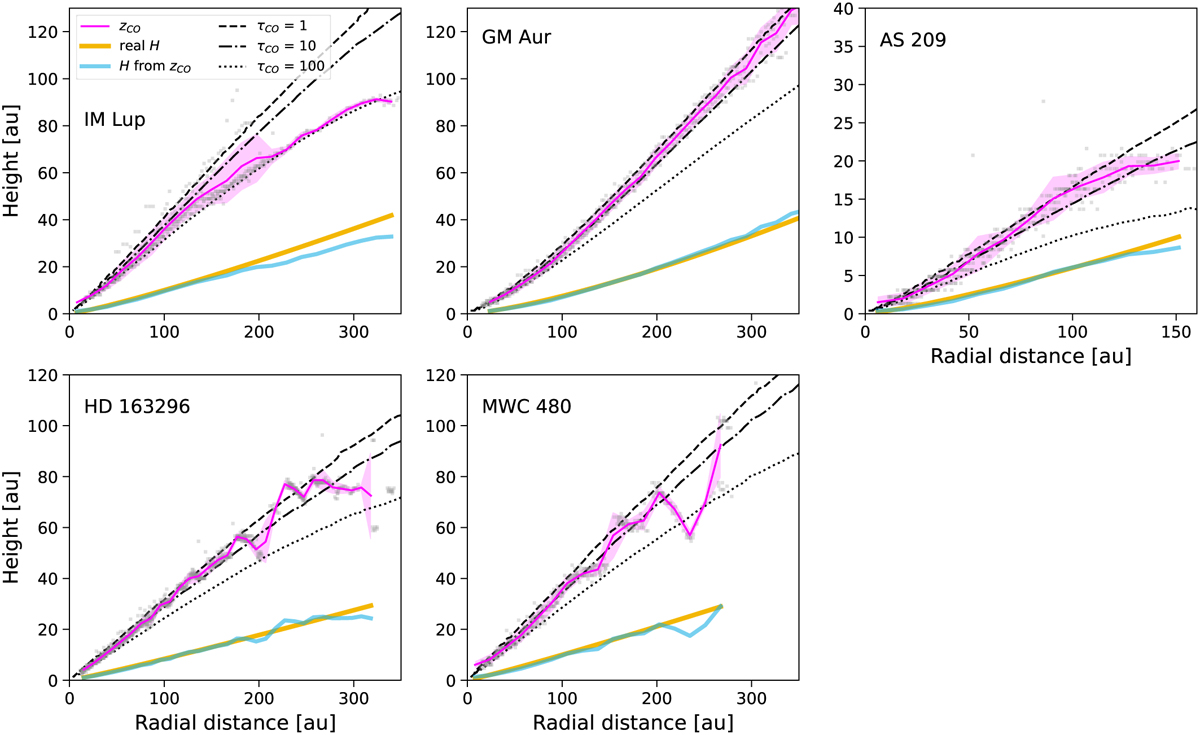
Results on the vertical location for 12CO (pink line) and the inferred pressure scale height (blue line). The 12CO vertical location is obtained with ALFAHOR through the analysis of mock channel maps generated from a DALI model that uses the surface density prescription from Zhang et al. (2021) for each disk. Points extracted from the synthetic channel maps are shown in grey for comparison with the average value (zCO). The inferred pressure scale height is calculated following Eq. (5). The pressure scale height used as input for the DALI models (H) is shown for comparison (yellow line). Dashed, dot-dashed, and dotted lines show the model location of the CO millimetre optical depths (τCO) 1, 10, and 100, respectively.
Current usage metrics show cumulative count of Article Views (full-text article views including HTML views, PDF and ePub downloads, according to the available data) and Abstracts Views on Vision4Press platform.
Data correspond to usage on the plateform after 2015. The current usage metrics is available 48-96 hours after online publication and is updated daily on week days.
Initial download of the metrics may take a while.