Fig. 5
Download original image
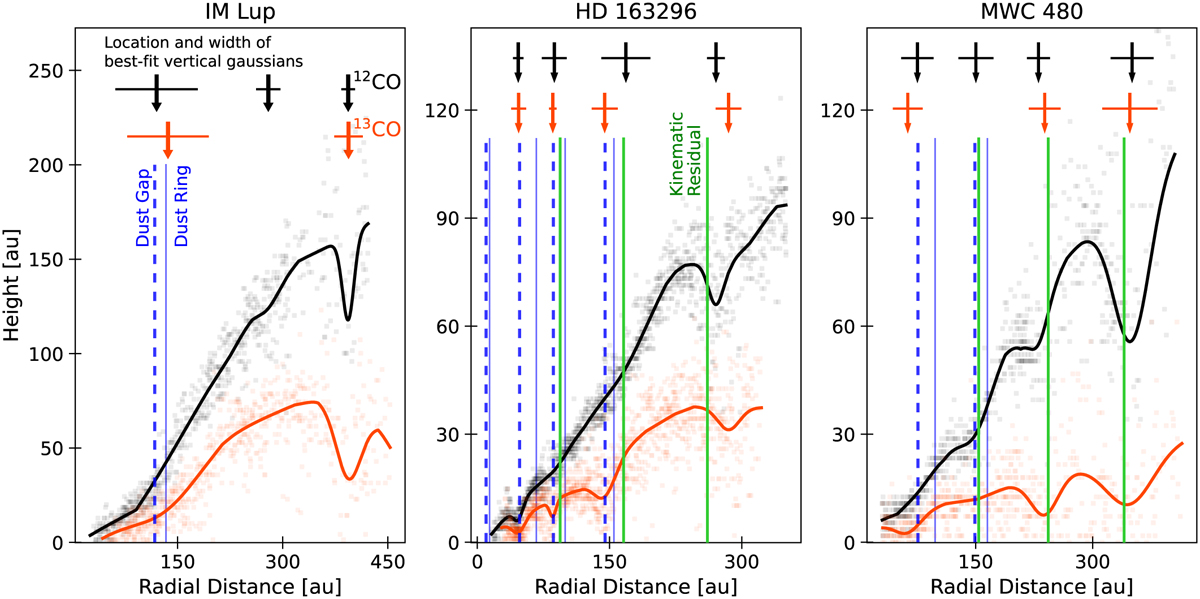
Data corresponding to 12CO J = 2−1 (in black) and 13CO J =2−1 (in orange) for three disks where modulations in the vertical surface are detected. Coloured dots indicate the extracted data from the channel maps for each tracer. Continuous lines trace the best-fit surface considering the reference baseline and a number of fitted Gaussians. The location and width of the Gaussians for each molecule are signaled at the top of each panel. Vertical blue lines trace the dust structure from Huang et al. (2018a). Vertical green lines show the reported kinematic residuals from Teague et al. (2021a) and Izquierdo et al. (2022).
Current usage metrics show cumulative count of Article Views (full-text article views including HTML views, PDF and ePub downloads, according to the available data) and Abstracts Views on Vision4Press platform.
Data correspond to usage on the plateform after 2015. The current usage metrics is available 48-96 hours after online publication and is updated daily on week days.
Initial download of the metrics may take a while.