| Issue |
A&A
Volume 668, December 2022
|
|
|---|---|---|
| Article Number | A170 | |
| Number of page(s) | 15 | |
| Section | Planets and planetary systems | |
| DOI | https://doi.org/10.1051/0004-6361/202244864 | |
| Published online | 21 December 2022 | |
Rapid formation of massive planetary cores in a pressure bump
1
University Observatory, Faculty of Physics, Ludwig-Maximilians-Universität München,
Scheinerstr. 1,
81679
Munich, Germany
e-mail: This email address is being protected from spambots. You need JavaScript enabled to view it.
2
Max Planck Institute for Solar System Research,
Justus-von-Liebig-Weg 3,
37077
Göttingen, Germany
3
Exzellenzcluster ORIGINS,
Boltzmannstr. 2,
85748
Garching, Germany
4
Institut für Theoretische Astrophysik, Zentrum für Astronomie, Heidelberg University,
Albert Ueberle Str. 2,
69120
Heidelberg, Germany
Received:
1
September
2022
Accepted:
8
November
2022
Abstract
Context. Models of planetary core growth by either planetesimal or pebble accretion are traditionally disconnected from the models of dust evolution and formation of the first gravitationally bound planetesimals. State-of-the-art models typically start with massive planetary cores already present.
Aims. We aim to study the formation and growth of planetary cores in a pressure bump, motivated by the annular structures observed in protoplanetary disks, starting with submicron-sized dust grains.
Methods. We connect the models of dust coagulation and drift, planetesimal formation in the streaming instability, gravitational interactions between planetesimals, pebble accretion, and planet migration into one uniform framework.
Results. We find that planetesimals forming early at the massive end of the size distribution grow quickly, predominantly by pebble accretion. These few massive bodies grow on timescales of ~100 000 yr and stir the planetesimals that form later, preventing the emergence of further planetary cores. Additionally, a migration trap occurs, allowing for retention of the growing cores.
Conclusions. Pressure bumps are favourable locations for the emergence and rapid growth of planetary cores by pebble accretion as the dust density and grain size are increased and the pebble accretion onset mass is reduced compared to a smooth-disc model.
Key words: accretion, accretion disks / planets and satellites: formation / protoplanetary disks / methods: numerical
© Tommy Chi Ho Lau et al. 2022
 Open Access article, published by EDP Sciences, under the terms of the Creative Commons Attribution License (https://creativecommons.org/licenses/by/4.0), which permits unrestricted use, distribution, and reproduction in any medium, provided the original work is properly cited.
This article is published in open access under the Subscribe-to-Open model. This email address is being protected from spambots. You need JavaScript enabled to view it. to support open access publication.
1 Introduction
Recent high-resolution interferometry observations by the Atacama Large Millimeter/submillimeter Array (ALMA) revealed that substructure may be common in protoplanetary discs, although we are still limited to the largest and thus brightest ones. Nevertheless, there is increasing evidence from comparison of the observational data of disc populations and theoretical models that disc substructures must be common even in unresolved discs (Toci et al. 2021; Zormpas et al. 2022). Multiple surveys, such as those of Andrews et al. (2018), Long et al. (2018), and Cieza et al. (2020), have shown that most of the substructures are presented in the form of axisymmetric rings. Through detailed analysis, Dullemond et al. (2018) found that dust trapping in a pressure bump is consistent with the rings sampled from the DSHARP survey. Kinematic studies with ALMA by Teague et al. (2018a,b) further showed that the dust rings coincide with the local pressure maxima in the analysed discs. However, the origin of such pressure bumps remains uncertain, where the possible causes include disc-planet interactions due to an existing massive planet (Rice et al. 2006; Pinilla et al. 2012; Dipierro et al. 2015; Dong et al. 2017), sublimation (Saito & Sirono 2011), and instabilities (Takahashi & Inutsuka 2014; Flock et al. 2015; Lorén-Aguilar & Bate 2015; Pinilla et al. 2016; Dullemond & Penzlin 2018).
Despite the uncertainty as to the cause, the dust-trapping pressure bump is likely a favourable environment for the formation and growth of planetesimals towards massive planetary cores (Morbidelli 2020; Guilera et al. 2020; Chambers 2021; Andama et al. 2022). The locally enriched dust-to-gas ratio could trigger streaming instability (Youdin & Lithwick 2007; Johansen et al. 2007, 2009; Bai & Stone 2010), which is the prevailing pathway to overcome the ‘metre-size barrier’ of dust growth (Weidenschilling 1977; Güttler et al. 2010; Zsom et al. 2010) to form planetesimals of on the order of 100 km in diameter (Johansen et al. 2012, 2015; Simon et al. 2016, 2017). More recently, Stammler et al. (2019) suggested that planetesimal formation by streaming instability, where the midplane dust-to-gas ratio is regulated, can explain the similarity in the optical depths of the DSHARP rings studied by Dullemond et al. (2018). Furthermore, in the hydrodynamical simulations with self gravity by Carrera et al. (2021), a small pressure bump can already trigger planetesimal formation by streaming instability with centimetre(cm)-sized grains, although this may not be applicable to the case with millimetre(mm)-sized dust (Carrera & Simon 2022).
In the classical model, planetesimal accretion has been shown to quickly enter a stage of oligarchic growth with direct-N body simulations (Kokubo & Ida 2000). A massive planetary core is unlikely to form and accrete gas within the typical lifetime of protoplanetary discs – particularly at wide orbits – to form a cold Jupiter with the minimum mass solar nebula, while multiple works (e.g. Fortier et al. 2007, 2009; Guilera et al. 2010) have shown that planetesimal accretion can be efficient in a significantly more massive disc. However, planetesimals that are large enough to gravitationally deflect dust from the gas streamline and have a sufficient encounter time can accrete a significant fraction of the drifting dust or ‘pebbles’. This emerged as a mechanism for efficient planetesimal growth often named ‘pebble accretion’ (Ormel & Klahr 2010; Lambrechts & Johansen 2012; Guillot et al. 2014; see Johansen & Lambrechts 2017; Ormel 2017, for review). In a pressure bump, pebbles are trapped and the locally enhanced dust surface density also provides an elevated level of pebble flux compared to that in a smooth disc. The impeded drifting speed of the pebbles also lengthens the encounter time with the planetesimal, particularly in the outer disc where the pebble-carrying headwind is faster. Both of these factors increase the rate of planetesimal growth by pebble accretion inside a pressure bump.
As planetesimals grow into more massive embryos, the gravitational torque exerted by the disc becomes important. For low-mass planets that induce small perturbations in the disc, the disc-planet interaction lies in the type-I (or low-mass) regime (Goldreich & Tremaine 1979; Artymowicz 1993; Tanaka et al. 2002; Tanaka & Ward 2004; Kley & Nelson see 2012, for review). As shown in the recent N-body planet-formation models (e.g. Matsumura et al. 2017; Bitsch et al. 2019; Liu et al. 2019), this poses a challenge: embryos formed in the outer Solar System should be stopped from entering the terrestrial planet region as they are needed in the outer Solar system to form cold giant planets. However, Coleman & Nelson (2016) showed that radial substructures in the disc can trap embryos at the outer edges and allow the formation of cold Jupiters. This suggests that pressure bumps are not only favourable to the growth of planetesimals but are also capable of retaining the massive planetary cores produced.
In this work, we present a numerical model of the formation and evolution of planetesimals in an axisymmetric pressure bump of a protoplanetary disc. We coupled the dust and gas evolution code DustPy (Stammler & Birnstiel 2022) with the parallelized symplectic N-body integrator SyMBAp (Lau & Lee, in prep.) with modifications to include gas drag, type-I damping and migration, and pebble accretion according to the disc model. As the disc evolves and accumulates dust at the pressure bump, a fraction of the dust is converted into planetesimals according to the condition for streaming instability. These planetesimals are then realised as N-body particles and evolve through gravitational interactions as well as the additional processes mentioned above. The details of our models and their initial conditions are presented in Sect. 2. The results of this work are presented in Sect. 3, and are followed by a discussion in Sect. 4. The findings of our work are summarised in Sect. 5.
2 Method
DustPy (Stammler & Birnstiel 2022), based on the model by Birnstiel et al. (2010), is employed to simulate a protoplanetary disc, which includes viscous evolution of the gas, and coagulation, fragmentation, advection, and diffusion of the dust. DustPy is coupled with SyMBAp (Lau & Lee, in prep.), which is a parallelized version of the symplectic direct N-body algorithm SyMBA (Duncan et al. 1998).
2.1 Disk model
2.1.1 Gas component
We considered a protoplanetary disc around a Solar-type star. The disc is assumed to be axisymmetric and in vertical hydrostatic equilibrium. The initial gas surface density Σg,init is set according to the self-similar solution of a viscous disc by Lynden-Bell & Pringle (1974) such that
 (1)
(1)
with the distance from the star r, the initial mass of the disc Mdisk, and the characteristic radius rc. We set Mdisk = 0.1M⊙ and rc = 100 au, which imply Σg,init ≈ 1400 g cm−2 at r = 1 au. The gas disc viscously evolves over time t according to the advection-diffusion equation:
![Mathematical equation: ${{\partial {{\rm{\Sigma }}_{\rm{g}}}} \over {\partial t}} = {3 \over r}{\partial \over {\partial r}}\left[ {{r^{1/2}}{\partial \over {\partial r}}\left( {v{{\rm{\Sigma }}_{\rm{g}}}{r^{1/2}}} \right)} \right],$](/articles/aa/full_html/2022/12/aa44864-22/aa44864-22-eq2.png) (2)
(2)
where the back reaction from the dust is neglected. The Shakura & Sunyaev (1973) α-parametrization is adopted for the kinematic viscosity v such that
 (3)
(3)
where cs is the speed of sound and Hg the disc scale height. The viscosity parameter α = 10−3 is set in this work. The disc scale height is defined by Hg ≡ cs/ΩK, where the local Keplerian orbital frequency  with the gravitational constant G and the mass of the central star M*. The isothermal sound speed is used and given by
  with the Boltzmann constant kB, the midplane temperature T, and the mean molecular weight of the gas µ = 2.3mp. The disc is assumed to be passively irradiated by the Solar luminosity, which gives a midplane temperature profile of
 (4)
(4)
This setup yields the dimensionless gas disc scale height
 (5)
(5)
The midplane pressure gradient parameter η is then given by
 (6)
(6)
where P is the midplane gas pressure, which describes the degree of ‘sub-Keplerity’ of the gas. A logarithmic radial grid is adopted that spans from 1 to 100 au with 99 cells for a disc gap at 10 au, and from 10 to 100 au with 66 cells for a disc gap at 75 au. Additional grid refinement is imposed around the exterior pressure bump of the gap (see Sect. 2.2).
2.1.2 Dust component
The initial dust surface density Σd,init is given by
 (7)
(7)
with the global dust-to-gas ratio Z set at the Solar metallicity of 0.01. We follow the size distribution of the interstellar medium (Mathis et al. 1977) for the initial dust grain sizes. The maximum initial size is set at 1µm and the internal density of 1.67 g cm−3 is assumed. A total of 141 dust mass bins are used, logarithmically spaced from 10−12 to 108 g. Each mass species is evolved in time through transport with the advection–diffusion equation (Clarke & Pringle 1988) coupled to growth and fragmentation with the Smoluchowski equation. The fragmentation velocity is assumed to be 10 m s−1 and dust aggregates are assumed to fragment at collision velocities above this value. The Stokes number Sti of each mass bin i is then calculated by considering the Epstein and the Stokes I regimes. The dust scale height of each mass species Hd,i is calculated according to Dubrulle et al. (1995):
 (8)
(8)
Further details of the gas and dust evolution algorithm are described in Stammler & Birnstiel (2022).
2.2 Disk gap
A stationary Gaussian gap is created in the disc following the model in Dullemond et al. (2018). A pre-existing planet in the gap is not considered in this work. As α∑g is a constant in our disc model at a steady state, the disc gap can be created from a smooth disc by adopting a modified α-parameter with radial dependence α′(r) given by
 (9)
(9)
where the function
![Mathematical equation: $F\left( r \right) = \exp \left[ { - A\exp \left( { - {{{{\left( {r - {r_0}} \right)}^2}} \over {2{w^2}}}} \right)} \right],$](/articles/aa/full_html/2022/12/aa44864-22/aa44864-22-eq12.png) (10)
(10)
where A is the amplitude of the gap, r0 its location, and w its width. We fixed A = 2 and tested two gap locations r0 = {10, 75} au. At r0 = 10 au, w is set to 2 au. At r0 = 75 au, w is scaled by r13/16, yielding w ≈ 10.3 au. This is motivated by the radial scaling of the gap width given by the empirical formula provided by Kanagawa et al. (2017) for the structure of a planet-induced gap. Combined with the disc model, the prescribed disc gap also results in a local maximum of gas surface density at the outer edge, which is also a local maximum of pressure. We note that the sign of η in Eq. (6) changes across the pressure maximum, where η > 0 implies sub-Keplerian gas and η < 0 implies super-Keplerian gas.
2.3 Planetesimal formation
As dust accumulates at the exterior pressure bump of the disc gap, the dust is converted into planetesimals based on the prescriptions in Drażkowska et al. (2016) and Schoonenberg et al. (2018) with the adoption of the smooth planetesimal formation activation function 𝒫pf in Miller et al. (2021). A smooth activation function that centres around a midplane dust-to-gas ratio ρd/ρg of unity is expected to be more probable than a sharp activation of the streaming instability, because the latter causes planetesimals to form in discrete pulses with sharp temporal fluctuations in our tests. The smooth activation function is given by
![Mathematical equation: ${P_{{\rm{pf}}}} = {1 \over 2}\left[ {1 + \tan \,h\left( {{{\log \left( {{\rho _{\rm{d}}}{\rm{/}}{\rho _{\rm{g}}}} \right)} \over n}} \right)} \right],$](/articles/aa/full_html/2022/12/aa44864-22/aa44864-22-eq13.png) (11)
(11)
with the smoothness parameter n set to 0.03 in this work. 𝒫pf is evaluated at each radial cell and the local dust surface density in each mass bin i is removed by
 (12)
(12)
where ζ is the planetesimal formation efficiency per settling time, which we set to 0.05 corresponding to a planetesimal conversion time of 40 settling times when the dust-to-gas ratio is unity. The settling time tset,i of mass bin i is given by
 (13)
(13)
We note that ζ is not well constrained while the effect of using a different value is not studied in this work. The local dust surface density loss is then summed over all mass bins and added to the local planetesimal surface density ∑plts, that is,
 (14)
(14)
Planetesimals are then realised from the radial profile of ∑plts(r). We adopted the cumulative mass distribution resulting from the fitting to the streaming instability simulations by Abod et al. (2019). This has the form of an exponentially truncated power law such that the number fraction of planetesimals above mass m is given by
 (15)
(15)
for m ≥ mmin with the minimum planetesimal mass mmin and the characteristic planetesimal mass MG. The form of Eq. (15) is shown in Fig. 1. Schäfer et al. (2017) noted that mmin is sensitive to the spacial resolution of the streaming instability simulation. Nonetheless, the total mass in each mass bin in logarithmic scale can be estimated by
 (16)
(16)
We set mmin = 10−2MG in this work, where the peak of dM is about 17.9 times that at mmin as shown in Fig. 2. As Eq. (15) → 0 only when m→ ∞, we artificially set the upper limit of m at 3MG in the algorithm of realisation, which implies that a small number fraction of planetesimals of about 8.48 × 10⁻⁶ is lost. Klahr & Schreiber (2020) considered the critical mass for gravitational collapse of a dust clump in the presence of turbulent diffusion. We adopted this mass as MG, which is given by
 (17)
(17)

with the small-scale diffusion parameter δ, which is independent of α in our model. As noted by Johansen et al. (2006), there is disagreement over the measurement of the relative strength of turbulent viscosity and turbulent diffusion in the literature, and this remains an active research topic (e.g. Schreiber & Klahr 2018). We tested two values of δ = {10−4, 10−5}. This is motivated by the measurements in streaming instability simulations by Schreiber & Klahr (2018). Depending on the box sizes, the values of the measured small-scale diffusion parameter in the radial direction range from 10−6 to 10−4 for the midplane dust-to-gas ratio of 1. As MG ∝ δ3/2, a huge number of planetesimals are produced for the case with δ = 10–6 in our preliminary runs, which is computationally unaffordable. Therefore, this value of δ is not tested in this work. The potential effect is discussed in Sect. 4.3. Also, St is evaluated by taking the density-averaged value across all mass bins in the local radial cell. We note that Abod et al. (2019) also provided a characteristic mass based on the balance between the tidal force and self-gravity, which has a dependence of  and is independent of the local diffusivity. This would result in a characteristic mass of ~10 M⊕ at 80 au in our disc model, which is not physically probable.
In each simulation, the semi-major axis a of a planetesimal is first randomly drawn using ∑plts(r) as a radial distribution function and MG is evaluated at the local radial cell. The planetesimal mass m is then drawn from Eq. (15). At each communication between DustPy and SyMBAp, if the total planetesimal mass accumulated in terms of surface density exceeds this value, a planetesimal is then realised and subtracted from the accumulated mass. The eccentricity e is randomly drawn from a Rayleigh distribution with the scale parameter 10−6. The inclination i in radians is also drawn from a Rayleigh distribution but with the scale parameter 5 × 10⁻⁷. Other angles of the orbital elements are drawn randomly from 0 to 2π. The physical radius Rp is calculated by assuming an internal density ρs of 1.5 g cm−3. The planetesimal surface density is then subtracted according to the m and a of the realised planetesimal. If the total planetesimal mass in the local cell is not enough, the planetesimal mass from the neighbouring cells is used for the subtraction as well. Afterwards, another value of m is drawn immediately and a planetesimal with mass m is realised until the remaining accumulated planetesimal mass is less than m. The last drawn value of m is retained for the next communication step such that the realisation is not biased towards lower mass. As this process does not guarantee that all mass in ∑plts can be realised, the residual is accumulated for the next communication step. Further details on the communication step are provided in Sect. 2.5.
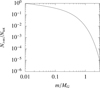 |
Fig. 1 Truncated power-law cumulative mass distribution adopted following Abod et al. (2019). |
 |
Fig. 2 Total mass in each logarithmic mass bin in the adopted plan-etesimal mass distribution. The mass in the most massive bin is about 17.9 times more massive than the bin at 10−2 MG. |
2.4 Planetesimal evolution
The realised planetesimals and a Solar-mass central star are then evolved by SyMBAp with full gravitational interactions as well as additional subroutines to include gas drag, type-I damping and migration, and pebble accretion. If two bodies collide, they are assumed to merge completely. Collisions are therefore perfectly inelastic in this work. At each communication step, other than the newly formed planetesimals in terms of surface density, the radial profiles of the gas component and the dust component are passed to SyMBAp. The gas component includes:
the gas surface density ∑g;
the midplane temperature T;
the gas disc scale height Hg;
the midplane gas density ρg, and;
the midplane pressure gradient parameter η,
and the dust component, for each mass bin i, includes
the Stokes number Sti;
the dust disc scale height Hd,i, and;
the dust surface density ∑d,i.
The mass of the accreted pebbles is also passed to DustPy and subtracted from the dust surface density as further discussed in Sect. 2.4.2. As the planetesimals gradually gain mass, they are referred to as embryos, protoplanets, or planetary cores in this work. Generally, planetesimal refers to a body that has not gained significant mass, while embryo refers to a body that has grown by more than an order of magnitude. Protoplanet refers to a massive dominating body in the context of viscous stirring among a crowd of planetesimals, while planetary core refers to a body that is sufficiently massive and has the potential to accrete gas and form a giant planet. Nonetheless, these bodies are not strictly distinctive and have no fundamental difference in the simulations. They are all treated as fully interacting particles.
2.4.1 Gas drag and type-I torques
Planetesimals and planets experience the combined effect of aerodynamic gas drag and type-I torques due to the planet-disc interaction in this work. Generally, in typical disc environment at 10 au, gas drag (∝m−1/3) is more dominant for small bodies, while type-I torques (∝m) gradually overtake for m ≳ 10−5 M⊕. As gas accretion and feedback are not considered, the transition to the high-mass regime (type-II) is not included.
We adopted the aerodynamic gas drag by Adachi et al. (1976) where
 (18)
(18)
where Cd is the drag coefficient and vrel is the relative velocity between the planetesimal and the gas. The gas flow is assumed to be laminar and cylindrical, where the magnitude is given by vK(1 − |η|) with the local Keplerian velocity vK. As the planetesimals in this work are much larger than a km in diameter, the large Reynolds number case is generally applicable for Cd, and we set the value to 0.5 (Whipple 1972). The gas density ρ at the position of the planetesimal z above the midplane is given by  .
.
For type-I damping and migration, we adopted the prescription based on dynamical friction by Ida et al. (2020). The timescales for the isothermal case and finite i while  (Appendix D of Ida et al. 2020) are implemented. The evolution timescales of the semi-major axis, eccentricity, and inclination are defined respectively by
 (19)
(19)
These timescales are given by, with  and
and  ,
,
![Mathematical equation: ${\tau _a} = {{{t_{{\rm{wav}}}}} \over {{C_{\rm{T}}}\hat h_{\rm{g}}^2}}\left[ {1 + {{{C_{\rm{T}}}} \over {{C_{\rm{M}}}}}\sqrt {{{\hat e}^2} + {{\hat i}^2}} } \right],$](/articles/aa/full_html/2022/12/aa44864-22/aa44864-22-eq28.png) (20)
(20)
![Mathematical equation: ${\tau _e} = 1.282{t_{{\rm{wav}}}}\left[ {1 + {{{{\left( {{{\hat e}^2} + {{\hat i}^2}} \right)}^{3/2}}} \over {15}}} \right],$](/articles/aa/full_html/2022/12/aa44864-22/aa44864-22-eq29.png) (21)
(21)
![Mathematical equation: ${\tau _i} = 1.805{t_{{\rm{wav}}}}\left[ {1 + {{{{\left( {{{\hat e}^2} + {{\hat i}^2}} \right)}^{3/2}}} \over {21.5}}} \right].$](/articles/aa/full_html/2022/12/aa44864-22/aa44864-22-eq30.png) (22)
(22)
The characteristic time twav (Tanaka et al. 2002) is given by
 (23)
(23)
where Σg and  are retrieved from the local radial cell of the disc model. Due to frequent close encounters in the planetesimal belt, the semi-major axes may briefly depart greatly from the instantaneous locations, resulting in an unphysical twav, which is then evaluated at the instantaneous r of the embryo instead of its semi-major axis, in contrast to the statement in Ida et al. (2020). The coefficients CM and CT are given by
 (24)
(24)
 (25)
(25)
where pΣ ≡ −d ln Σg/d ln r and qT ≡ −d ln T/d ln r, which are evaluated with the local radial cell as well as the immediate neighbouring ones. The three timescales are then applied to the equation of motion,
 (26)
(26)
in the cylindrical coordinate system using the notation (r, θ, z) where the velocity of the embryo v = (vr, vθ, vz). Also, vK is evaluated at the instantaneous r of the embryo. Ida et al. (2020) noted that local uniformity on the scale of Hg is assumed in the derivations. This condition is satisfied for the disc gap implemented in this work, as described in Sect. 2.2, where the half width is wider than the local Hg at both locations of 10 and 75 au.
2.4.2 Pebble accretion
The planetesimals are formed in a dust-enhanced location, where significant growth by pebble accretion is expected. We adopted the pebble accretion efficiency єPA by Liu & Ormel (2018) and Ormel & Liu (2018), which is defined as the mass fraction of the pebble flux accreted by the planetesimal or planet. This prescription includes both the ballistic regime and the settling regime of pebble accretion, and considers the local disc conditions and the orbit of the pebble-accreting embryo. In particular, the e and i of the embryo are taken into account when evaluating the relative velocity with respect to the pebble, which is critical in a planetesimal belt because viscous stirring is significant. As a substructured disc is considered in this work, the ‘pebble formation front’ model by Lambrechts & Johansen (2014) cannot be applied, as explicitly noted by the authors, where a finite and positive η is assumed.
We note that η changes sign across the pressure bump and requires careful treatment. For the relative velocity between the pebble and an embryo in circular orbit, the direction of the Hill shear also changes sign for super-Keplerian pebbles drifting outwards from the inner orbits. Therefore, the existing expression combining the headwind- and shear-dominated regimes is still valid (Eq. (10) in Liu & Ormel 2018) and the absolute value of η should be used in this case. As the radial profile of η is given in a radial grid from DustPy, to capture the narrow region where η can be very close to zero, the value of η is interpolated at the radial position of each embryo before the absolute value is taken.
Following Drażkowska et al. (2021), the pebble-accretion rate is calculated by summing the respective rates for each mass bin i at the local radial cell, which is given by multiplying the corresponding єPA,i to the pebble flux  . The pebble drift velocity vdrift,i of mass bin i is given by (Weidenschilling 1977)
 (27)
(27)
The accretion rate can be summarised as
 (28)
(28)
 (29)
(29)
As η is expected to cross zero in our disc model, we note that this means vdrift = 0 when η = 0 with Eq. (27) and єPA is undefined. In our implementation, this would give  , as the supply of pebbles by headwind is halted. The mass of the accreted pebbles of each mass bin in the respective radial cell is then subtracted from the dust component of the disc in the next immediate communication step. Nonetheless, the contribution from the turbulence of the gas and the diffusion of the dust on vdrift are neglected, and only the pebbles supplied by the headwind is considered; that is, a more conservative pebble accretion rate is adopted. The possible implications of this are further discussed in Sect. 4.1.
As this work neglects the gas feedback from the embryos onto the disc, the simulation is stopped once any particle reaches one-tenth of the local pebble isolation mass miso, which is given by (Lambrechts et al. 2014):
 (30)
(30)
Nevertheless, Sándor & Regály (2021) reported that the pebble isolation mass may be about two to three times larger at a pressure bump, while the results presented in Bitsch et al. (2018) do not support this conclusion.
2.5 Numerical setup
The time step in DustPy ∆tdisk is variable and is determined by the rate of change of the gas and dust surface densities, while SyMBAp requires a fixed time step of ∆tnbod for the symplecticity. For all the simulations in this work, ∆tdisk > ∆tnbod. Therefore, after ∆tdisk is evaluated in DustPy, it is rounded down to the nearest integral multiple of ∆tnbod. With the time step determined, DustPy takes one step, and SyMBAp takes a number of ∆tdisk/∆tnbod steps in parallel. Communication is then made via MPI, where the data of the newly formed planetesimals (Sect. 2.3), the relevant gas and dust components (Sect. 2.4), and the rounded ∆tdisk are passed from DustPy to SyMBAp, and, the data of the accreted pebbles (Sect. 2.4.2) are passed from SyMBAp to DustPy. Afterwards, DustPy and SyMBAp take their respective step(s) again in parallel and this process repeats until the simulation ends.
For the simulations with the disc gap at 10 au, ∆tnbod = 0.5 yr is used and particles are removed if the heliocentric distance is less than 5 au or greater than 103 au. Also, for the gap location of 75 au, ∆tnbod = 20 yr is used and particles are removed if the heliocentric distance is less than 50 au instead. The additional subroutines for gas drag, type-I damping and migration, and pebble accretion are added to SyMBAp following the integration step in Matsumura et al. (2017) as
 (31)
(31)
where the time step τ = ∆tnbod, the operator 𝒫 handles the effect of pebble accretion, ℳ handles the effect of gas drag, type-I damping, and migration, and 𝒩 is the second-order symplectic integrator in the original SyMBAp. Also, 𝒫 and ℳ operate in the heliocentric coordinates and 𝒩 operates in the democratic heliocentric coordinates; therefore, coordinate transformations are done at each step.
In this work, two gap locations r0 = {10, 75} au and two values of the local diffusion parameter δ = {10−4, 10−5} are tested. Five simulations for each combination are conducted in order to minimise the statistical effect, which means a total of 20 simulations are conducted and presented in the following section.
Summary of the combinations of parameters, the times required for each combination to reach the t0 where the first planetesimal was formed, and the time when 0.1miso is reached.
3 Results
In each simulation, some time is required for the gap to attain the prescribed form and accumulate enough dust to trigger planetesimal formation by streaming instability. We define the time at which the first planetesimal is realised as t0 and Table 1 summarises the time required to reach t0 for each simulation. As the masses of the planetesimals are drawn randomly, simulations with the same parameter may not reach t0 at the same time and a small variation is recorded. Simulations end when 0.1miso is reached and the respective times are also summarised in Table 1. Descriptions for each set of parameters are shown in the following subsections.
 |
Fig. 3 Dust distribution at t0 of one of the five simulations for the disc gap at 10 au and δ = 10−4. The heat map shows the radial profile of the midplane dust density σd for different dust mass md. The white lines show the md corresponding to St = 0.1 (solid) and 0.01 (dotted), respectively. The green and blue lines show the drift and the fragmentation limits, respectively. The dust mass is shown to be limited by the fragmentation limit (≫mm) at the dust trap near 14 au. |
3.1 Disk gap at 10 au and δ = 10−4
Figure 3 shows the radial dust distribution of one of the five simulations at t0, where the heat map shows the profile of the midplane dust density σd for different dust mass md. The drift and the fragmentation limits are shown by the green and blue lines, respectively. These diagrams show that the dust mass is only limited by the fragmentation limit (≫mm) at the pressure bump near 14 au. The inward-drifting dust from the outer disc is trapped and coagulation continues. Planet formation by streaming instability occurs as enough dust accumulates at the pressure bump.
Figures 4 and 5 show the results of the five simulations for r0 = 10 au and δ = 10−4. Figure 4a shows the radial profiles of the gas and dust surface densities as well as that of the dust-to-gas ratio when planetesimals start to form in one of the simulations. We note that there is no significant difference in the disc profiles among the simulations and the disc profiles did not change drastically up to the end of the simulations. The disc gap is shown centred at 10 au as prescribed and dust accumulates at the outer edge of the gap. Across the local pressure maximum, as shown by the radial profiles from one of the simulations in Fig 4b, both  and η cross zero and switch sign, where the negative values are denoted by the dashed lines. However, just outside of this narrow region, the peaks of
  are almost up to 104M⊕ Myr−1 while η is still lower than 10−2 at the these two locations.
In Fig. 4c, panels (i) to (iii) show the mass and semi-major axis of the planetesimals at different times. The colours show the results from each of the five simulations and the bodies that reached 10−2M⊙ are denoted with large dots. In this case, the characteristic planetesimal mass MG ≈ 3 × 10⁻³M⊙, while there are small variations in time and distance as the disc is slowly evolving and the planetesimals do not form at the same location r. We define t0 as the time at which the formation of planetesimals has just started. At t0 (Fig. 4c i), just enough dust has accumulated at the pressure bump and planetesimal formation starts around the local pressure maximum at about 14.2 au. Planetesimals continue to form and some grow rapidly through pebble accretion as in Fig. 4c ii at t0 + 5 × 10³ yr. The five simulations ended from t0 + 2.2 × 10⁴ to t0 + 3.4 × 10⁴ yr as 0.1 miso ≈ 4.1M⊙ is reached in each of them (Fig. 4c iii). The presence of the narrow region with low pebble flux does not appear to have a significant effect on the growth of the plan-etesimals in this setup. The coloured lines in Fig. 4c (iii) show the trajectories of the most massive body in each simulation. The massive planetary cores remain near the pressure bump with slight inward migration, which also started scattering the smaller planetesimals.
Figure 5 shows further details of the effect of viscous stirring. Panels a (i) to (iii) show the eccentricity and mass of the planetesimals at the respective times in Fig. 4c. In Fig. 5a, the trajectory of the most massive body at the end of each simulation is shown by the coloured line, and that for the most massive body with m < 10−2M⊙ is shown by the grey line. The dashed line shows a pebble accretion onset mass assuming η = 10−3 and St = 10−1, which is further discussed in Sect. 4.2. From Fig. 5a (i–ii), the planetesimals form early, and close to the massive end of the distribution they grow rapidly by pebble accretion and stir the planetesimals formed later on (referred to here as the ‘latecomers’). In Fig. 5a (iii), the most massive body in each simulation has relatively low eccentricity throughout the entire simulation. The latecomers, which are born after an embryo has already grown significantly to ~1 M⊙, are being stirred to high eccentricity as shown by the grey trajectories. This halts pebble accretion, even though their inclinations are still lower than the pebble disc scale height as shown in Fig. 5b. Meanwhile, the role of gas drag does not appear to be significant in the results, which is likely because of the large (> 100 km) size of the planetesimals in our model and the strong dynamical heating due to the rapidly formed massive cores. The role of viscous stirring and pebble accretion is further discussed in Sect. 4.2.
The differential mass distributions at the end (Fig. 5c) show that only a small number of massive cores (≥M⊕) are formed in each of the simulations. In this setup, the simulations are quickly stopped as 0.1 miso is reached, which happens shortly after only a small number of planetesimals have formed. The form of the initial mass distribution is not clearly shown, although most planetesimals do not grow significantly. We note that less than ten mergers occur in each of the simulations, which have no significant effect on the growth and the final mass of the bodies.
 |
Fig. 4 Simulation results for the disk gap at 10 au and δ = 10−4, where MG ≈ 3 × 10⁻³M⊕. (a) Radial profiles in one of the five simulations of the dust and gas surface densities as well as the dust-to-gas ratio at t0 when planetesimal formation starts, (b) Pebble flux |

 |
Fig. 5 Further simulation results for the disc gap at 10 au and δ = 10−4. (a) Time sequence of planetesimal eccentricity e and mass m. The coloured trajectories follow the most massive bodies and the grey trajectories follow the most massive ones under 10−2 M⊕ in each of the simulations. The dashed lines denote the pebble accretion onset mass discussed in Sect. 4.2. (b) Planetesimal inclination i and mass m at the end, where the i of most bodies is still lower than the pebble disc scale height, (c) Differential mass distribution at the end of the model with ten mass bins in each decade. This shows that only a few massive cores are formed while the simulations stop before a large population of planetesimals is formed. |
3.2 Disc gap at 10 au and δ = 10−5
Another set of five simulations with r0 = 10 au and δ = 10−5 were conducted, for comparison with the results where δ = 10−4. As suggested by Eq. (17), the change of δ means that MG is 103/2, that is about 32 times lower than when δ = 10−4. With the characteristic mass MG ≈ 9 × 10⁻⁵M⊕, the number of planetesimals produced is much higher. The dust and gas surface densities, pebble flux, and η show no significant difference with respect to the case of δ = 10−4 as other parameters are unchanged. The five simulations ended from t0 + 3.4 × 10⁴ to t0 + 5.1 × 10⁴ yr.
Figure 6 shows the results of models with δ = 10−5. As previously, only the planetesimals that are formed early and massive can start pebble accretion immediately after formation. Similar to the case with δ = 10−4, these bodies grow efficiently and stir up the population of smaller planetesimals. The grey trajectories in Fig. 6a (iii) show more clearly that some small bodies could still grow briefly by pebble accretion from about 10−4M⊕ to just below 10−2M⊕ but further growth is halted due to their high eccentricities. Although the inclinations of the small planetesimals shown in Fig. 6b are not much higher than the pebble disc scale height, they cannot still accrete pebbles. Figure 6c shows that the majority of the planetesimal population did not grow significantly. The form of the initial mass distribution (Fig. 1) is retained and only a small number of massive cores are formed. In each of the simulations, about 200 mergers occur, which is dominated by the massive cores accreting small planetesimals. The mass difference between the two populations is more than four orders of magnitude, and so these mergers have no significant effect on the final masses of the massive planetary cores.
3.3 Disk gap at 75 au and δ = 10−4
Figures 7 and 8 show the results of the five simulations for r0 = 75 au and δ = 10−4. Figure 7a shows the pressure bump centring at 75 au as prescribed and the outer pressure maxima is at about 100 au. Compared to the setup with the disc gap at 10 au, Fig. 7b shows that the pebble flux is only slightly lower near the pressure bump, while η is a few times higher in general. The five simulations ended from t0 + 1.2 × 10⁵ to t0 + 2.2 × 10⁵ yr as 0.1miso ≈ 17.2 M⊕ is reached in each of them. Similarly, the m-r time sequence (Fig. 7c) shows that the planetesimals formed early accrete pebbles efficiently and reach the pebble isolation mass in about 0.1 Myr. We note that MG is similar to that for the simulations with r0 = 10 au, which is due the increase in ĥg being mostly offset by the increase in the mass-averaged St.
Figure 8 shows further details of the results, which are again similar those for the case where r0 = 10 au and δ = 10−4 (Fig. 5). In the time sequence (Fig. 8a), the planetesimals formed early grow by pebble accretion at a slower but still rapid rate and stir the latecomers to eccentric orbits that stop pebble accretion. Figure 8b shows that the inclinations of planetesimals remain even lower, which is around the values drawn at their realisation. Nonetheless, the small bodies still cannot accrete pebbles due to high relative pebble velocity and only a small number of massive bodies are formed, as shown in Fig. 8c.
3.4 Disc gap at 75 au and δ = 10−5
Figure 9 shows the results of the five simulations for r0 = 75 au and δ = 10−5. The five simulations ended between t0 + 2.4 × 10⁵ and t0 + 3.1 × 10⁵ yr. Similar to the previous cases, only the planetesimals that formed early and relatively large can accrete pebbles efficiently, which is similar to the case where r0 = 10 au and δ = 10−5. The results also confirm that growth is dominated by the large embryos, which viscously stir the majority of the planetesimals. Pebble accretion again cannot operate for these excited bodies due to high pebble relative velocities, even though their inclinations are much lower than the pebble disc scale height. In comparison to the case where r0 = 10 au and δ = 10−5, a smaller numbers of larger embryos (≥M⊕) are formed at the end.
 |
Fig. 6 Simulation results for the disc gap at 10 au and δ = 10−5, which ended from t0 + 3.4 × 10⁴ to t0 + 5.1 × 10⁴ yr. (a) e-m time sequence, showing that only the planetesimals formed early and relatively massive can accrete pebbles efficiently and stir up the latecomers, (b) i-m plot at the end of the simulations, showing that the inclinations of the small planetesimals are still not significantly larger than the pebble disc scale height, (c) Differential mass distribution at the end, showing that the majority of the planetesimals do not grow significantly by pebble accretion and retain the form of the initial mass distribution as shown in Fig. 1. Only a small number of massive cores are formed in the simulations. |
 |
Fig. 7 Simulation results for the disc gap at 75 au and δ = 10−4. (a) The radial profiles of the disc when planetesimal formation starts, (b) Radial profiles of pebble flux Ṁpeb showing that it is still high around the pressure bump, yet slightly lower compared to the models at 10 au shown in Fig. 4b. The pressure support parameter η is generally a few times higher while the regions of low η still coincide with the peaks of the pebble flux, (c) m-r time sequence, showing similar results except the planetesimals are formed later and the growth rate is slower. The five simulations ended from t0 + 1.2 × 10⁵ to t0 + 2.2 × 10⁵ yr. |
 |
Fig. 8 Further simulation results for the disc gap at 75 au and δ = 10−4. (a) e-m time sequence, showing that a small number of massive cores are formed, which excite and prevent the growth of the latecomers. This is similar to the results to the case with r0 = 10 au and δ = 10−4. (b) i-m plot at the end of the simulations, showing that the inclinations remain very low for all bodies, i.e. around the values drawn at their formation, (c) Differential mass distribution at the end also shows only a small number of massive cores are formed and the simulations are stopped before a large population of planetesimals is produced. This is also similar to the case with r0 = 10 au and δ = 10−4. |
 |
Fig. 9 Simulation results for the disc gap at 75 au and δ = 10−5, which ended from t0 + 2.4 × 10⁵ to t0 + 3.1 × 10⁵ yr. (a) e-m time sequence, showing that a small number of massive embryos started growth early and stirred the majority of the late-forming planetesimals into eccentric orbits, (b) i-m plot at the end of the simulations, showing that the i of all bodies remains far lower than the pebble disc scale height and confirms that the pebble relative velocity is critical, (c) Compared to the case of r0 = 10 au and δ = 10−5, the differential mass distribution shows an even smaller number of massive cores formed in these simulations. |
4 Discussions
4.1 Pressure bump
The results presented in this work show that the environment in a pressure bump is favourable to the rapid formation of massive planetary cores in numerous possible ways, which is in agreement with the results of Morbidelli (2020), Guilera et al. (2020) and Chambers (2021). Firstly, dust drifting from the outer disc is trapped and accumulated at the exterior edge of the disc gap. In this way, a pebble passing the planet orbit without being accreted is not lost to the inner disc, but can be accreted at later passages. This circumvents the issue of the requirement of large pebble masses (Ormel 2017). Secondly, as the midplane dust-to-gas ratio gradually increases, it can reach the critical level for streaming instability. The grain sizes are also just limited by the fragmentation limit (≫mm). Therefore, planetesimal formation by streaming instability is possible in this specific environment. The planetesimals are formed within the regions of high pebble density and can accrete them efficiently.
Furthermore, the headwind, which carries the dust or pebbles, is slower around the pressure bump. In the headwind regime, the relative velocity of the pebbles is mostly determined by ηvK, which is applicable to a dynamically cold planetesimal belt. The pebble accretion onset mass in this case can be estimated using the following equation (Visser & Ormel 2016; Ormel 2017):
 (32)
(32)
In both cases of r0 = 10 au and 75 au, η at the location of the peak of the pebble flux is a few times lower than that in a smooth disc. This greatly decreases the required mass for efficient pebble accretion, particularly in the outer disc as  . Combining the decreased MPA,hw and the enhanced Ṁpeb, the planetesimals formed early that are well in the headwind regime can easily initiate rapid growth by pebble accretion. In our setup, the growth timescale in the settling regime at the pressure bump is ~103 −104 yr for r0 = 10 au and is a few times higher for r0 = 75 au.
We note that Ṁpeb is very low in the immediate vicinity of the peak of the pressure bump in our model, where the pebble drift velocity switches sign and crosses zero with η. This results from our assumptions that pebbles are only supplied by radial drift due to the headwind in the disc. In a more realistic scenario, pebbles are also transported by turbulent diffusion. This effect is negligible when the headwind dominates the supply of pebbles. However, at the pressure bump, the headwind changes direction and is weak within a narrow region (e.g. Figs. 4b and 7b). In this case, turbulent diffusion can supply pebbles to this region such that the pebble flux is always finite and smooth. Although these effects are modelled by DustPy in the disc, the prescription of the pebble accretion efficiency by Liu & Ormel (2018) and Ormel & Liu (2018) is yielded from a model with a finite headwind, which ranges from 15 to 60 ms−1. It remains uncertain whether or not the same prescriptions can be applied to pebbles transported by turbulent diffusion as well as those effectively transported by the relative radial motion of the embryo. Therefore, in this work, we only consider the pebble flux due to the headwind in the disc, which is proportional to |η|, which would result in a more conservative pebble accretion rate.
Nonetheless, the presence of this region of small Ṁpeb does not appear to have a significant effect on the growth of the planetesimals, which is likely because of the finite width and the dynamical spreading of the planetesimal belt. The value of Ṁpeb is also exceptionally high (>103M⊕ Myr−1) just outside of this region. However, the width of this low-pebble-flux zone shall change with the shape of the disc gap, which may have a more significant effect on the growth of the planetesimals with a different prescription.
In other works adopting a smooth disc model, as the embryos become massive, the rapid type-I migration is shown to cause these bodies to quickly move to the inner disc. However, in our model with the pressure bump, these massive planetary cores are retained, which is similar to the results for planet migration in a structured disc found by Coleman & Nelson (2016). In the adopted migration prescription for an embryo with low eccentricity and inclination, the sign of τa is determined by the coefficient CT in Eq. (20). Also, CT is given by Eq. (25), which depends on p∑ and qT. Figure 10 shows the migration parameters at the end of one of the simulations with r0 = 10 au as an example, where τa and τe are calculated assuming e = 10−3 and i = e/2. In our disc model, qT is constant throughout the disc, while p∑ varies greatly and switches sign across the pressure bump as shown in Fig. 10a. This implies that CT also switches sign and is negative slightly interior to the pressure maximum (Fig. 10b). As the migration direction changes from inward to outward going into the pressure bump from the exterior (Fig. 10c), this helps to retain the massive embryos at wide orbits as shown in our results in Sect. 3. Nonetheless, we note that the mass dependence of the migration trap (e.g. Chrenko et al. 2022) is not studied in our work because gas accretion and gap opening, which occur upon the formation of massive planetary cores, are not considered in our model.
4.2 Pebble accretion and viscous stirring
When a planetesimal is in an eccentric orbit, the relative velocity of the pebbles is no longer dominated by the headwind but by the orbital velocity of the planetesimal instead. In the adopted pebble accretion prescription provided by Liu & Ormel (2018) and Ormel & Liu (2018), the azimuthal pebble relative velocity is given by
 (33)
(33)
where vcir combines the headwind and the Hill regimes in the circular limit. Also, vecc corresponds to the eccentric limit where vecc = 0.76evK. For small planetesimals, pebble accretion mostly does not operate in the Hill regime. Therefore, the pebble accretion onset mass in Eq. (32) can be refined into a more general form, where
![Mathematical equation: ${M_{{\rm{PA}}}} = {\rm{St}}\,{\left[ {\max \left( {\left| \eta \right|,0.76\,e} \right)} \right]^3}{M_*}.$](/articles/aa/full_html/2022/12/aa44864-22/aa44864-22-eq49.png) (34)
(34)
This mass is denoted by the dashed line in the e-m plots in Sect. 3, assuming St = 0.1 and η = 10−3.
The shear-dominated (low-energy) regime of viscous stirring (Ida & Makino 1993) is applicable as the em and im of the newly born latecomers are very low before reaching the equilibrium values. The stirring timescale for eccentricity is much shorter than that for inclination and dynamical friction is ineffective (Ida 1990). This is more significant in the results for δ = 10−4, where e ≪ i in general, even at the end of the simulations. Furthermore, in the results for δ = 10−5, the excitation in e occurs much earlier than that for i, while the equipartition of energy is only reached in some of the simulations. In this regime, the protoplanet–planetesimal viscous stirring timescale for eccentricity is given by (Ida & Makino 1993)
 (35)
(35)
where em,rms is the root-mean-square value of em and the mass of the protoplanet M. When a massive embryo has formed, the latecomers are stirred to high eccentricities within a very short timescale. Any newly formed planetesimals are excited to high eccentricity quickly, which results in a MPA ≫ MPA,hw for them. As a result, pebble accretion cannot operate even if the latecomers have mass greater than MPA,hw.
Meanwhile, the e of the massive bodies is damped efficiently by the type-I torques as τe ∝ twav ∝ m−1, which enables continuous pebble accretion. In the example for r0 = 10 au as shown in Fig. 10d, type-I damping gradually becomes significant (≲106 yr) for m ≳ 10−1 M⊕. Thus, the latecomers are prevented from pebble accretion as a result of both viscous stirring from the massive planet formed earlier and the inefficient type-I damping.
This also implies that a window period exists between the time of the formation of the first planetesimal with m > MPA,hw and the time when it becomes massive enough to halt pebble accretion for the less massive bodies. During this window period, a few of the planetesimals formed with m > MPA ~ MPA,hw can still grow by a few orders of magnitude in mass as shown in our results.
For example, Fig. 11 shows the evolution of the differential mass distribution of one of the simulations with r0 = 10 au and δ = 10−5. The red line in each panel shows the corresponding pebble accretion timescale τPA ≡ m/ṁ with respect to m. τPA is estimated near the centre of the planetesimal belt at 14.2 au using the root-mean-square eccentricity of all bodies erms. The estimation also assumes Ṁpeb = 103M⊕ Myr−1 and St = 0.1. The top panel, at t0 + 5 × 10⁴ yr, shows that when a massive body has not formed and erms is low, MPA = MPA,hw is about 10−4M⊕ where τPA ~ 104 yr. Rapid growth is possible for the bodies at the massive end of the planetesimal mass distribution. As a few embryos grow significantly in mass and excite erms to above 0.76η, the eccentric limit of pebble accretion becomes applicable. The middle panel, at t0 + 2 × 10⁵ yr, shows that MPA starts to shift away from the majority of the planetesimals. The leading bodies dominate growth and the bottom panel, at t0 + 3.7 × 10⁵ yr, shows that the small planetesimals are further excited and MPA increases drastically. The grey histogram shows the distribution of the initial mass of all planetesimals produced throughout the simulation. The bodies of ≳10−3M⊕ were born within the window period such that the masses had grown by at least an order of magnitude before MPA overtook them.
The exact number of massive cores formed by the end of the simulations is then also determined by the rate of planetesimal formation, which is not explored in this work. As the transition between the headwind and the eccentric limits becomes critical in this scenario, the expression for ∆vy in Eq. (33) would benefit from further refinement, for a smoother and more physical expression.
We note that this mechanism is conceptually different from the ‘viscous stirring pebble accretion’ in Levison et al. (2015), where pebble accretion for smaller bodies is stalled due to high inclinations. In our model, the pebble disc scale height for each dust species is given by Eq. (8), which is about 0.32Hg for α = 10−3 and St = 0.1. Furthermore, in the results presented in Sect. 3, the inclinations of the small bodies have not been significantly stirred away from the pebble disc in general but pebble accretion is already effectively stopped by the increased relative velocity of the pebbles.
 |
Fig. 10 Radial profiles of the migration-related parameters at the end of one of the simulations with r0 = 10 au. (a) qT remains constant in our disc model, while p∑ varies greatly and changes sign across the pressure bump. (b) Coefficients for τa also change sign but at slightly different locations according to Eqs. (24) and (25), respectively. (c) τa near the pressure bump for embryos of different masses with e = 10−3 and i = e/2, where inward migration is denoted by red and outward migration is denoted by blue. The migration rate slows down and changes sign slightly interior (≈14 au) to the location of planetesimal formation (≈14.2 au). (d) τe at the same locations, which is ∝twav ∝ m−1. This shows type-I damping starts to become efficient when the embryos are ≳10−1 M⊕. |
 |
Fig. 11 Differential mass distribution from one of the simulations with r0 = 10 au and δ = 10−5 at t0 + 5 × 10⁴ yr (top), t0 + 2 × 10⁵ yr (middle), and t0 + 3.7 × 10⁵ yr (bottom) with ten mass bins in each decade. The red line in each panel shows the corresponding estimation of the pebble accretion timescale τPA with respect to mass for the instantaneous erms of all bodies. The grey histogram in the bottom panel shows the initial mass of all planetesimals produced throughout the simulation. The evolution shows a window period exists where significant growth by pebble accretion is possible. This period starts from the time of the formation of the first planetesimal with m > MPA,hw and ends at the time when it becomes massive enough to excite the less massive bodies to high eccentricity in a short timescale. |
4.3 Characteristic mass MG
The characteristic mass of the initial planetesimal mass distribution given by Eq. (17) is sensitive to the small-scale diffusion parameter where MG ∝ δ3/2. We only tested the values of δ = {10−4, 10−5} due to computational limits, while the measurements by Schreiber & Klahr (2018) range from 10−4 to 10−6. A strong dependence on the simulation domain size is also shown in the work of these latter authors.
As planetesimal accretion is inefficient in our parameter space, pebble accretion is only possible for the planetesimals with sufficient inital mass. For the results of δ = 10−4 shown in Sects. 3.1 and 3.3, MG > MPA,hw. In this case, planetesimals that are formed slightly later than the first one can still accrete pebbles and grow by at least an order of magnitude in mass. Also, 0.1 miso is reached only after a small population of planetesimals have formed. The form of the initial mass distribution cannot be retrieved from the end results. In contrast, for δ = 10−5 shown in Sects. 3.1 and 3.3, MG ~ MPA,hw. Fewer bodies are formed with mass between the most massive cores and the vast population of small planetesimals. The distinction between these two classes is much clearer. As a result, the initial distribution of planetesimals is mostly presented and preserved in this case.
Although the rapid formation of massive planetary cores is possible with the parameters tested, we expect that for a very low δ, pebble accretion may not occur as MG ≪ MPA,hw. Also, the timescale of runaway planetesimal accretion is given by (Ormel et al. 2010)
 (36)
(36)
Planetesimal accretion is also unlikely to be efficient enough to reach MPA,hw within the typical disc lifetime, particularly at the outer disc. This will likely result in a population of plan-etesimals where the initial mass distribution is preserved. This consequence is also consistent with the recent work by Lorek & Johansen (2022), who find that the seeds for pebble accretion are unlikely to form through planetesimal accretion beyond 5–10 au within the typical disc lifetime.
4.4 Potential effects of a planet in the disc gap
In this work, a planet in the disc gap is not considered while the results show that the growth of planetesimals by pebble accretion is also sensitive to viscous stirring. This implies that if there exists a planet in the gap, the planetesimal belt formed at the pressure bump may be heated and prevented from growth by pebble accretion. For instance, the fitting of a planet-induced gap in the simulations by Kanagawa et al. (2017) has a half width o m2. Meanwhile, the half width of the heated zone of a planet (Ida & Makino 1993) scales with its Hill radius, where ∝m1/3. This implies that there may exist a regime transition as the gap-opening planet grows in mass, because the gap expands faster than the heated zone. However, the exact width of the heated zone also depends on the e and i of the planetesimals as shown in Ida & Makino (1993). This requires further modelling, with the inclusion of gas accretion and feedback onto the gas disc. For instance, our model neglects the effect of the recently proposed thermal torque mainly due to heat released from solid accretion (Benítez-Llambay et al. 2015; Masset 2017; Guilera et al. 2021) and the effect of the dust torque (Benítez-Llambay & Pessah 2018).
4.5 Other recent works
Planet growth by pebble accretion in a substructured disc was also recently studied by Morbidelli (2020). In this work, the dust ring is assumed to be in a steady-state, which is described by a Gaussian distribution. The work of this latter author shows that planets may migrate slightly inwards but out of the dust-concentrated region, where growth by pebble accretion is significantly slowed down. In comparison, the dust-to-gas ratio in our model is much higher at the outer edge of the disc gap (e.g. Figs. 4a and 7a). As the disc gap is only prescribed towards the gas component, the dust component evolves around it and results in a much higher dust density at the pressure bump. Also, Morbidelli (2020) adopted a migration prescription for a non-isothermal disc, in contrast to our model. As the coefficients of the migration torque are different between the isothermal and non-isothermal cases, the planet trap is located at a different position. Further investigations into the effect of migration in the context of substructured discs and planetary growth are required.
In the work by Guilera et al. (2020), planet formation in an ice-line(~3 au)-induced pressure bump is also studied with a model that includes dust growth, planetesimal formation by streaming instability, pebble accretion, and planet migration. In this model, a uniform initial radius of 100 km for the plan-etesimals is adopted. When an embryo reaches lunar mass, the effects of pebble accretion, gas accretion, and planet migration are enabled for that object. Rapid formation of massive planetary cores is also demonstrated and the pressure bump acts as a planet trap for a planet with mass ≲10 M⊕. In comparison, we adopted a distribution of initial planetesimal mass and demonstrated the effect of viscous stirring on pebble accretion using full N-body simulations. However, the initial planetesimal mass adopted in our work is generally much larger. The effect of planetesimal accretion is not noticeable because of the greater distance from the star. Once a massive core is formed, the neighbouring plan-etesimals are likely scattered and a new gap should form due to the planet-disc interactions; this new gap shall form a pressure bump at a new location.
Chambers (2021) studied the formation of cold Jupiters in a substructured disc starting with embryos of ~10−4 M⊕. A series of eight pressure bumps is prescribed and the embryos are placed at the respective locations of the ‘pebble trap’. In addition to pebble accretion, gas drag, type-I torques, gas accretion, and gap opening are also included in this latter model. The results of these latter authors also show that massive planetary cores can form rapidly in a pressure bump, which acts as a migration trap as well. Meanwhile, the production of planetesimals is not considered in this latter model, something which is also favoured in the pressure bump, and pebbles are added to the disc locally after 400 orbital periods. As planetesimals are formed in a region of concentrated dust, those above MPA can immediately start pebble accretion as shown in our model.
In the recent work by Jiang & Ormel (2023), planetesimal growth in a clumpy ring and a pressure-induced dust ring are studied. In their case, a constant mass flux is supplied from the outer disc and a single Stokes number is assumed for the pebbles. In contrast, in the present work, we model the dust and gas evolution of the entire protoplanetary disc where mass is conserved globally. We also include the variation in the Stokes numbers of different mass species at different locations, which is critical to the initial planetesimal mass distribution and the pebble accretion efficiency.
A similar pebble-accretion efficiency prescription is adopted in the work of Jiang & Ormel (2023). We note that the factor of 1/η from ϵPA is eliminated for the pebble-accretion rate while η = 0 at the local pressure maximum. This implicitly assumes that the pebble flux due to the radial motion of the planet, turbulence in the disc, and diffusion of the dust is equivalent to that due to the headwind. In Sect. 4.1, we discuss the fact that the prescription of ϵPA is taken from models with non-zero headwind. Therefore, we have taken a more conservative approach by considering only the pebble flux due to the headwind for accretion in our work.
A migration prescription for a smooth disc with an artificial migration strength prefactor is also adopted in the work of these latter authors. Meanwhile, in the prescription by Ida et al. (2020) adopted in this work, the local slopes of the surface density and temperature profiles are taken into account, which naturally stop inward migration slightly interior to but not exactly at the pressure bump. Nonetheless, we note that these prescriptions assume a local uniformity on the scale of Hg. Further studies are required for a sharp pressure bump.
The work of Jiang & Ormel (2023) also shows that pebble accretion is efficient with low eccentricity, which is consistent with our results for the massive planetary cores formed. In addition, with a mass spectrum of planetesimals, the smaller or later-forming planetesimals are significantly excited and pebble accretion is halted as demonstrated in this work.
Jang et al. (2022) also studied the subsequent evolution of planetesimals formed by streaming instability in a smooth disc with a constant pebble flux. These authors modelled a planetesimal belt with a width of ∆r = ηr at different locations of the disc. Their results show that rapid growth by pebble accretion is not possible at the outer disc due to the strong headwind, which drastically increases the pebble accretion onset mass. In the results with type-I migration, Jang et al. (2022) also find rapid inward migration for the embryos that reach ~1 M⊕. In contrast, as discussed in Sect. 4.1, planetesimals can still accrete pebbles efficiently in our results due to weakened headwind in the pressure bump, and are also retained near the pressure bump due to the change in the slope of the gas surface density.
5 Conclusions
This work demonstrates the possibility of rapid formation of massive planetary cores in a pressure bump starting from interstellar-medium-sized dust. The dust and gas evolution code DustPy is used to model a protoplanetary disc consistently. DustPy is coupled with the parallelized N-body code SyMBAp to integrate a large number of planetesimals. According to the evolving disc, the planetesimals also experience the effects of gas drag, type-I migration, and pebble accretion.
As the micron-sized dust particles coagulate up to the centimetre to metre regime, the pressure bump traps the dust drifting from the outer disc. The locally enhanced dust-to-gas ratio can then trigger planetesimal formation by streaming instability. These km-sized planetesimals are naturally born in a location where the pebble flux is exceptionally large and the headwind is weakened. This allows the planetesimals that are formed both early and relatively massive to grow efficiently by pebble accretion even in the outer disc. Only a small number of massive cores (~M⊕) are formed as the later-formed planetesimals are excited into eccentric orbits, where pebble accretion is halted. The massive embryos are retained near the dust trap as the direction of migration switches to outward migration slightly interior to the local pressure maximum. A natural continuation of this work is the inclusion of gas accretion and feedback onto the protoplanetary disc in the model. This shall provide further insights into the open questions regarding the architecture of the Solar System as well as those of other exoplanetary systems.
Nonetheless, the characteristic masses of the planetesimals adopted in this work are limited by computational costs. As pebble accretion is unlikely to be efficient for even smaller planetesimals, further analysis of the initial mass distribution of planetesimals resulting from streaming instability is merited, which has been an active research topic; see for example Simon et al. (2016, 2017), Schäfer et al. (2017), Abod et al. (2019), Li et al. (2019) and Rucska & Wadsley (2020).
As pebble accretion may not operate in a heated planetesimal belt due to the high relative velocity of the pebbles, a pre-existing planet in the gap may immediately excite the newly formed planetesimals. This depends on the width of the gap and that of the heated zone. Neither a planet-induced gap nor the shape of the disc gap are explored in this work. These ingredients of our model require further investigation.
Acknowledgements
We thank Chris Ormel and Beibei Liu for the insightful discussions. We acknowledge funding from the European Research Council (ERC) under the European Union’s Horizon 2020 research and innovation programme under grant agreement No 714769 and funding by the Deutsche Forschungsgemeinschaft (DFG, German Research Foundation) under grant 325594231 and Germany’s Excellence Strategy - EXC-2094 - 390783311 and EXC 2181/1 - 390900948 (the Heidelberg STRUCTURES Excellence Cluster). J.D. was funded by the European Union under the European Union’s Horizon Europe Research & Innovation Programme 101040037 (PLANETOIDS). Views and opinions expressed are however those of the authors only and do not necessarily reflect those of the European Union or the European Research Council. Neither the European Union nor the granting authority can be held responsible for them.
References
- Abod, C. P., Simon, J. B., Li, R., et al. 2019, ApJ, 883, 192 [Google Scholar]
- Adachi, I., Hayashi, C., & Nakazawa, K. 1976, Prog. Theor. Phys., 56, 1756 [CrossRef] [Google Scholar]
- Andama, G., Ndugu, N., Anguma, S. K., & Jurua, E. 2022, mNrAS, 512, 5278 [NASA ADS] [CrossRef] [Google Scholar]
- Andrews, S. M., Huang, J., Pérez, L. M., et al. 2018, ApJ, 869, L41 [NASA ADS] [CrossRef] [Google Scholar]
- Artymowicz, P. 1993, ApJ, 419, 155 [NASA ADS] [CrossRef] [Google Scholar]
- Bai, X.-N., & Stone, J. M. 2010, ApJ, 722, 1437 [NASA ADS] [CrossRef] [Google Scholar]
- Benítez-Llambay, P., & Pessah, M. E. 2018, ApJ, 855, L28 [Google Scholar]
- Benítez-Llambay, P., Masset, F., Koenigsberger, G., & Szulágyi, J. 2015, Nature, 520, 63 [Google Scholar]
- Birnstiel, T., Dullemond, C. P., & Brauer, F. 2010, A&A, 513, A79 [NASA ADS] [CrossRef] [EDP Sciences] [Google Scholar]
- Bitsch, B., Morbidelli, A., Johansen, A., et al. 2018, A&A, 612, A30 [NASA ADS] [CrossRef] [EDP Sciences] [Google Scholar]
- Bitsch, B., Izidoro, A., Johansen, A., et al. 2019, A&A, 623, A88 [NASA ADS] [CrossRef] [EDP Sciences] [Google Scholar]
- Carrera, D., & Simon, J. B. 2022, ApJ, 933, L10 [NASA ADS] [CrossRef] [Google Scholar]
- Carrera, D., Simon, J. B., Li, R., Kretke, K. A., & Klahr, H. 2021, AJ, 161, 96 [Google Scholar]
- Chambers, J. 2021, ApJ, 914, 102 [NASA ADS] [CrossRef] [Google Scholar]
- Chrenko, O., Chametla, R. O., Nesvorný, D., & Flock, M. 2022, A&A, 666, A63 [NASA ADS] [CrossRef] [EDP Sciences] [Google Scholar]
- Cieza, L. A., González-Ruilova, C., Hales, A. S., et al. 2020, MNRAS, 501, 2934 [Google Scholar]
- Clarke, C. J., & Pringle, J. E. 1988, MNRAS, 235, 365 [NASA ADS] [CrossRef] [Google Scholar]
- Coleman, G. A. L., & Nelson, R. P. 2016, MNRAS, 460, 2779 [NASA ADS] [CrossRef] [Google Scholar]
- Dipierro, G., Price, D., Laibe, G., et al. 2015, MNRAS, 453, L73 [NASA ADS] [CrossRef] [Google Scholar]
- Dong, R., Li, S., Chiang, E., & Li, H. 2017, ApJ, 843, 127 [Google Scholar]
- Drażkowska, J., Alibert, Y., & Moore, B. 2016, A&A, 594, A105 [CrossRef] [EDP Sciences] [Google Scholar]
- Drażkowska, J., Stammler, S. M., & Birnstiel, T. 2021, A&A, 647, A15 [NASA ADS] [Google Scholar]
- Dubrulle, B., Morfill, G., & Sterzik, M. 1995, Icarus, 114, 237 [Google Scholar]
- Dullemond, C. P., & Penzlin, A. B. T. 2018, A&A, 609, A50 [NASA ADS] [CrossRef] [EDP Sciences] [Google Scholar]
- Dullemond, C. P., Birnstiel, T., Huang, J., et al. 2018, ApJ, 869, L46 [NASA ADS] [CrossRef] [Google Scholar]
- Duncan, M. J., Levison, H. F., & Lee, M. H. 1998, AJ, 116, 2067 [Google Scholar]
- Flock, M., Ruge, J. P., Dzyurkevich, N., et al. 2015, A&A, 574, A68 [NASA ADS] [CrossRef] [EDP Sciences] [Google Scholar]
- Fortier, A., Benvenuto, O. G., & Brunini, A. 2007, A&A, 473, 311 [NASA ADS] [CrossRef] [EDP Sciences] [Google Scholar]
- Fortier, A., Benvenuto, O. G., & Brunini, A. 2009, A&A, 500, 1249 [NASA ADS] [CrossRef] [EDP Sciences] [Google Scholar]
- Goldreich, P., & Tremaine, S. 1979, ApJ, 233, 857 [Google Scholar]
- Guilera, O. M., Brunini, A., & Benvenuto, O. G. 2010, A&A, 521, A50 [NASA ADS] [CrossRef] [EDP Sciences] [Google Scholar]
- Guilera, O. M., Sándor, Z., Ronco, M. P., Venturini, J., & Miller Bertolami, M. M. 2020, A&A, 642, A140 [NASA ADS] [CrossRef] [EDP Sciences] [Google Scholar]
- Guilera, O. M., Miller Bertolami, M. M., Masset, F., et al. 2021, MNRAS, 507, 3638 [NASA ADS] [CrossRef] [Google Scholar]
- Guillot, T., Ida, S., & Ormel, C. W. 2014, A&A, 572, A72 [NASA ADS] [CrossRef] [EDP Sciences] [Google Scholar]
- Güttler, C., Blum, J., Zsom, A., Ormel, C. W., & Dullemond, C. P. 2010, A&A, 513, A56 [Google Scholar]
- Ida, S. 1990, Icarus, 88, 129 [CrossRef] [MathSciNet] [Google Scholar]
- Ida, S., & Makino, J. 1993, Icarus, 106, 210 [NASA ADS] [CrossRef] [Google Scholar]
- Ida, S., Muto, T., Matsumura, S., & Brasser, R. 2020, MNRAS, 494, 5666 [Google Scholar]
- Jang, H., Liu, B., & Johansen, A. 2022, A&A, 664, A86 [NASA ADS] [CrossRef] [EDP Sciences] [Google Scholar]
- Jiang, H., & Ormel, C. W. 2023, MNRAS, 518, 3877 [Google Scholar]
- Johansen, A., & Lambrechts, M. 2017, Annu. Rev. Earth Planet. Sci., 45, 359 [Google Scholar]
- Johansen, A., Klahr, H., & Mee, A. J. 2006, MNRAS, 370, L71 [NASA ADS] [Google Scholar]
- Johansen, A., Oishi, J. S., Low, M.-M.M., et al. 2007, Nature, 448, 1022 [NASA ADS] [CrossRef] [Google Scholar]
- Johansen, A., Youdin, A., & Low, M.-M.M. 2009, ApJ, 704, L75 [NASA ADS] [CrossRef] [Google Scholar]
- Johansen, A., Youdin, A. N., & Lithwick, Y. 2012, A&A, 537, A125 [NASA ADS] [CrossRef] [EDP Sciences] [Google Scholar]
- Johansen, A., Low, M.-M.M., Lacerda, P., & Bizzarro, M. 2015, Sci. Adv., 1, e1500109 [NASA ADS] [CrossRef] [Google Scholar]
- Kanagawa, K. D., Tanaka, H., Muto, T., & Tanigawa, T. 2017, PASJ, 69, 97 [NASA ADS] [CrossRef] [Google Scholar]
- Klahr, H., & Schreiber, A. 2020, ApJ, 901, 54 [NASA ADS] [CrossRef] [Google Scholar]
- Kley, W., & Nelson, R. 2012, Annu. Rev. Astron. Astrophys., 50, 211 [CrossRef] [Google Scholar]
- Kokubo, E., & Ida, S. 2000, Icarus, 143, 15 [Google Scholar]
- Lambrechts, M., & Johansen, A. 2012, A&A, 544, A32 [NASA ADS] [CrossRef] [EDP Sciences] [Google Scholar]
- Lambrechts, M., & Johansen, A. 2014, A&A, 572, A107 [NASA ADS] [CrossRef] [EDP Sciences] [Google Scholar]
- Lambrechts, M., Johansen, A., & Morbidelli, A. 2014, A&A, 572, A35 [NASA ADS] [CrossRef] [EDP Sciences] [Google Scholar]
- Levison, H. F., Kretke, K. A., & Duncan, M. J. 2015, Nature, 524, 322 [CrossRef] [Google Scholar]
- Li, R., Youdin, A. N., & Simon, J. B. 2019, ApJ, 885, 69 [NASA ADS] [CrossRef] [Google Scholar]
- Liu, B., & Ormel, C. W. 2018, A&A, 615, A138 [NASA ADS] [CrossRef] [EDP Sciences] [Google Scholar]
- Liu, B., Ormel, C. W., & Johansen, A. 2019, A&A, 624, A114 [NASA ADS] [CrossRef] [EDP Sciences] [Google Scholar]
- Long, F., Pinilla, P., Herczeg, G. J., et al. 2018, ApJ, 869, 17 [Google Scholar]
- Lorek, S., & Johansen, A. 2022, A&A, 666, A108 [NASA ADS] [CrossRef] [EDP Sciences] [Google Scholar]
- Lorén-Aguilar, P., & Bate, M. R. 2015, MNRAS, 453, L78 [CrossRef] [Google Scholar]
- Lynden-Bell, D., & Pringle, J. E. 1974, MNRAS, 168, 603 [Google Scholar]
- Masset, F. S. 2017, MNRAS, 472, 4204 [NASA ADS] [CrossRef] [Google Scholar]
- Mathis, J. S., Rumpl, W., & Nordsieck, K. H. 1977, ApJ, 217, 425 [Google Scholar]
- Matsumura, S., Brasser, R., & Ida, S. 2017, A&A, 607, A67 [NASA ADS] [CrossRef] [EDP Sciences] [Google Scholar]
- Miller, E., Marino, S., Stammler, S. M., et al. 2021, MNRAS, 508, 5638 [NASA ADS] [CrossRef] [Google Scholar]
- Morbidelli, A. 2020, A&A, 638, A1 [Google Scholar]
- Ormel, C. W. 2017, The Emerging Paradigm of Pebble Accretion, eds. M. Pessah, & O. Gressel (Cham: Springer International Publishing), 197 [Google Scholar]
- Ormel, C. W., & Klahr, H. H. 2010, A&A, 520, A43 [NASA ADS] [CrossRef] [EDP Sciences] [Google Scholar]
- Ormel, C. W., & Liu, B. 2018, A&A, 615, A178 [NASA ADS] [CrossRef] [EDP Sciences] [Google Scholar]
- Ormel, C. W., Dullemond, C. P., & Spaans, M. 2010, ApJ, 714, L103 [NASA ADS] [CrossRef] [Google Scholar]
- Pinilla, P., Benisty, M., & Birnstiel, T. 2012, A&A, 545, A81 [NASA ADS] [CrossRef] [EDP Sciences] [Google Scholar]
- Pinilla, P., Flock, M., Ovelar, M.D.J., & Birnstiel, T. 2016, A&A, 596, A81 [NASA ADS] [CrossRef] [EDP Sciences] [Google Scholar]
- Rice, W. K. M., Armitage, P. J., Wood, K., & Lodato, G. 2006, MNRAS, 373, 1619 [Google Scholar]
- Rucska, J. J., & Wadsley, J. W. 2020, MNRAS, 500, 520 [NASA ADS] [CrossRef] [Google Scholar]
- Saito, E., & Sirono, S.-I. 2011, ApJ, 728, 20 [NASA ADS] [CrossRef] [Google Scholar]
- Schäfer, U., Yang, C.-C., & Johansen, A. 2017, A&A, 597, A69 [Google Scholar]
- Schoonenberg, D., Ormel, C. W., & Krijt, S. 2018, A&A, 620, A134 [NASA ADS] [CrossRef] [EDP Sciences] [Google Scholar]
- Schreiber, A., & Klahr, H. 2018, ApJ, 861, 47 [Google Scholar]
- Shakura, N. I., & Sunyaev, R. A. 1973, A&A, 24, 337 [NASA ADS] [Google Scholar]
- Simon, J. B., Armitage, P. J., Li, R., & Youdin, A. N. 2016, ApJ, 822, 55 [Google Scholar]
- Simon, J. B., Armitage, P. J., Youdin, A. N., & Li, R. 2017, ApJ, 847, L12 [NASA ADS] [CrossRef] [Google Scholar]
- Sándor, Z., & Regály, Z. 2021, MNRAS, 503, L67 [CrossRef] [Google Scholar]
- Stammler, S. M., & Birnstiel, T. 2022, ApJ, 935, 35 [NASA ADS] [CrossRef] [Google Scholar]
- Stammler, S. M., Drazkowska, J., Birnstiel, T., et al. 2019, ApJ, 884, L5 [NASA ADS] [CrossRef] [Google Scholar]
- Takahashi, S. Z., & Inutsuka, S.-I. 2014, ApJ, 794, 55 [NASA ADS] [CrossRef] [Google Scholar]
- Tanaka, H., & Ward, W. R. 2004, ApJ, 602, 388 [Google Scholar]
- Tanaka, H., Takeuchi, T., & Ward, W. R. 2002, ApJ, 565, 1257 [Google Scholar]
- Teague, R., Bae, J., Bergin, E. A., Birnstiel, T., & Foreman-Mackey, D. 2018a, ApJ, 860, L12 [NASA ADS] [CrossRef] [Google Scholar]
- Teague, R., Bae, J., Birnstiel, T., & Bergin, E. A. 2018b, ApJ, 868, 113 [Google Scholar]
- Toci, C., Rosotti, G., Lodato, G., Testi, L., & Trapman, L. 2021, MNRAS, 507, 818 [NASA ADS] [CrossRef] [Google Scholar]
- Visser, R. G., & Ormel, C. W. 2016, A&A, 586, A66 [NASA ADS] [CrossRef] [EDP Sciences] [Google Scholar]
- Weidenschilling, S. J. 1977, MNRAS, 180, 57 [Google Scholar]
- Whipple, F. L. 1972, in From Plasma to Planet, ed. A. Elvius (Hoboken: Wiley), 211 [Google Scholar]
- Youdin, A. N., & Lithwick, Y. 2007, Icarus, 192, 588 [NASA ADS] [CrossRef] [Google Scholar]
- Zormpas, A., Birnstiel, T., Rosotti, G. P., & Andrews, S. M. 2022, A&A, 661, A66 [NASA ADS] [CrossRef] [EDP Sciences] [Google Scholar]
- Zsom, A., Ormel, C. W., Güttler, C., Blum, J., & Dullemond, C. P. 2010, A&A, 513, A57 [NASA ADS] [CrossRef] [EDP Sciences] [Google Scholar]
All Tables
Summary of the combinations of parameters, the times required for each combination to reach the t0 where the first planetesimal was formed, and the time when 0.1miso is reached.
All Figures
|
Fig. 1 Truncated power-law cumulative mass distribution adopted following Abod et al. (2019). |
| In the text | |
|
Fig. 2 Total mass in each logarithmic mass bin in the adopted plan-etesimal mass distribution. The mass in the most massive bin is about 17.9 times more massive than the bin at 10−2 MG. |
| In the text | |
|
Fig. 3 Dust distribution at t0 of one of the five simulations for the disc gap at 10 au and δ = 10−4. The heat map shows the radial profile of the midplane dust density σd for different dust mass md. The white lines show the md corresponding to St = 0.1 (solid) and 0.01 (dotted), respectively. The green and blue lines show the drift and the fragmentation limits, respectively. The dust mass is shown to be limited by the fragmentation limit (≫mm) at the dust trap near 14 au. |
| In the text | |
|
Fig. 4 Simulation results for the disk gap at 10 au and δ = 10−4, where MG ≈ 3 × 10⁻³M⊕. (a) Radial profiles in one of the five simulations of the dust and gas surface densities as well as the dust-to-gas ratio at t0 when planetesimal formation starts, (b) Pebble flux |
| In the text | |
|
Fig. 5 Further simulation results for the disc gap at 10 au and δ = 10−4. (a) Time sequence of planetesimal eccentricity e and mass m. The coloured trajectories follow the most massive bodies and the grey trajectories follow the most massive ones under 10−2 M⊕ in each of the simulations. The dashed lines denote the pebble accretion onset mass discussed in Sect. 4.2. (b) Planetesimal inclination i and mass m at the end, where the i of most bodies is still lower than the pebble disc scale height, (c) Differential mass distribution at the end of the model with ten mass bins in each decade. This shows that only a few massive cores are formed while the simulations stop before a large population of planetesimals is formed. |
| In the text | |
|
Fig. 6 Simulation results for the disc gap at 10 au and δ = 10−5, which ended from t0 + 3.4 × 10⁴ to t0 + 5.1 × 10⁴ yr. (a) e-m time sequence, showing that only the planetesimals formed early and relatively massive can accrete pebbles efficiently and stir up the latecomers, (b) i-m plot at the end of the simulations, showing that the inclinations of the small planetesimals are still not significantly larger than the pebble disc scale height, (c) Differential mass distribution at the end, showing that the majority of the planetesimals do not grow significantly by pebble accretion and retain the form of the initial mass distribution as shown in Fig. 1. Only a small number of massive cores are formed in the simulations. |
| In the text | |
|
Fig. 7 Simulation results for the disc gap at 75 au and δ = 10−4. (a) The radial profiles of the disc when planetesimal formation starts, (b) Radial profiles of pebble flux Ṁpeb showing that it is still high around the pressure bump, yet slightly lower compared to the models at 10 au shown in Fig. 4b. The pressure support parameter η is generally a few times higher while the regions of low η still coincide with the peaks of the pebble flux, (c) m-r time sequence, showing similar results except the planetesimals are formed later and the growth rate is slower. The five simulations ended from t0 + 1.2 × 10⁵ to t0 + 2.2 × 10⁵ yr. |
| In the text | |
|
Fig. 8 Further simulation results for the disc gap at 75 au and δ = 10−4. (a) e-m time sequence, showing that a small number of massive cores are formed, which excite and prevent the growth of the latecomers. This is similar to the results to the case with r0 = 10 au and δ = 10−4. (b) i-m plot at the end of the simulations, showing that the inclinations remain very low for all bodies, i.e. around the values drawn at their formation, (c) Differential mass distribution at the end also shows only a small number of massive cores are formed and the simulations are stopped before a large population of planetesimals is produced. This is also similar to the case with r0 = 10 au and δ = 10−4. |
| In the text | |
|
Fig. 9 Simulation results for the disc gap at 75 au and δ = 10−5, which ended from t0 + 2.4 × 10⁵ to t0 + 3.1 × 10⁵ yr. (a) e-m time sequence, showing that a small number of massive embryos started growth early and stirred the majority of the late-forming planetesimals into eccentric orbits, (b) i-m plot at the end of the simulations, showing that the i of all bodies remains far lower than the pebble disc scale height and confirms that the pebble relative velocity is critical, (c) Compared to the case of r0 = 10 au and δ = 10−5, the differential mass distribution shows an even smaller number of massive cores formed in these simulations. |
| In the text | |
|
Fig. 10 Radial profiles of the migration-related parameters at the end of one of the simulations with r0 = 10 au. (a) qT remains constant in our disc model, while p∑ varies greatly and changes sign across the pressure bump. (b) Coefficients for τa also change sign but at slightly different locations according to Eqs. (24) and (25), respectively. (c) τa near the pressure bump for embryos of different masses with e = 10−3 and i = e/2, where inward migration is denoted by red and outward migration is denoted by blue. The migration rate slows down and changes sign slightly interior (≈14 au) to the location of planetesimal formation (≈14.2 au). (d) τe at the same locations, which is ∝twav ∝ m−1. This shows type-I damping starts to become efficient when the embryos are ≳10−1 M⊕. |
| In the text | |
|
Fig. 11 Differential mass distribution from one of the simulations with r0 = 10 au and δ = 10−5 at t0 + 5 × 10⁴ yr (top), t0 + 2 × 10⁵ yr (middle), and t0 + 3.7 × 10⁵ yr (bottom) with ten mass bins in each decade. The red line in each panel shows the corresponding estimation of the pebble accretion timescale τPA with respect to mass for the instantaneous erms of all bodies. The grey histogram in the bottom panel shows the initial mass of all planetesimals produced throughout the simulation. The evolution shows a window period exists where significant growth by pebble accretion is possible. This period starts from the time of the formation of the first planetesimal with m > MPA,hw and ends at the time when it becomes massive enough to excite the less massive bodies to high eccentricity in a short timescale. |
| In the text | |
Current usage metrics show cumulative count of Article Views (full-text article views including HTML views, PDF and ePub downloads, according to the available data) and Abstracts Views on Vision4Press platform.
Data correspond to usage on the plateform after 2015. The current usage metrics is available 48-96 hours after online publication and is updated daily on week days.
Initial download of the metrics may take a while.