Fig. 8
Download original image
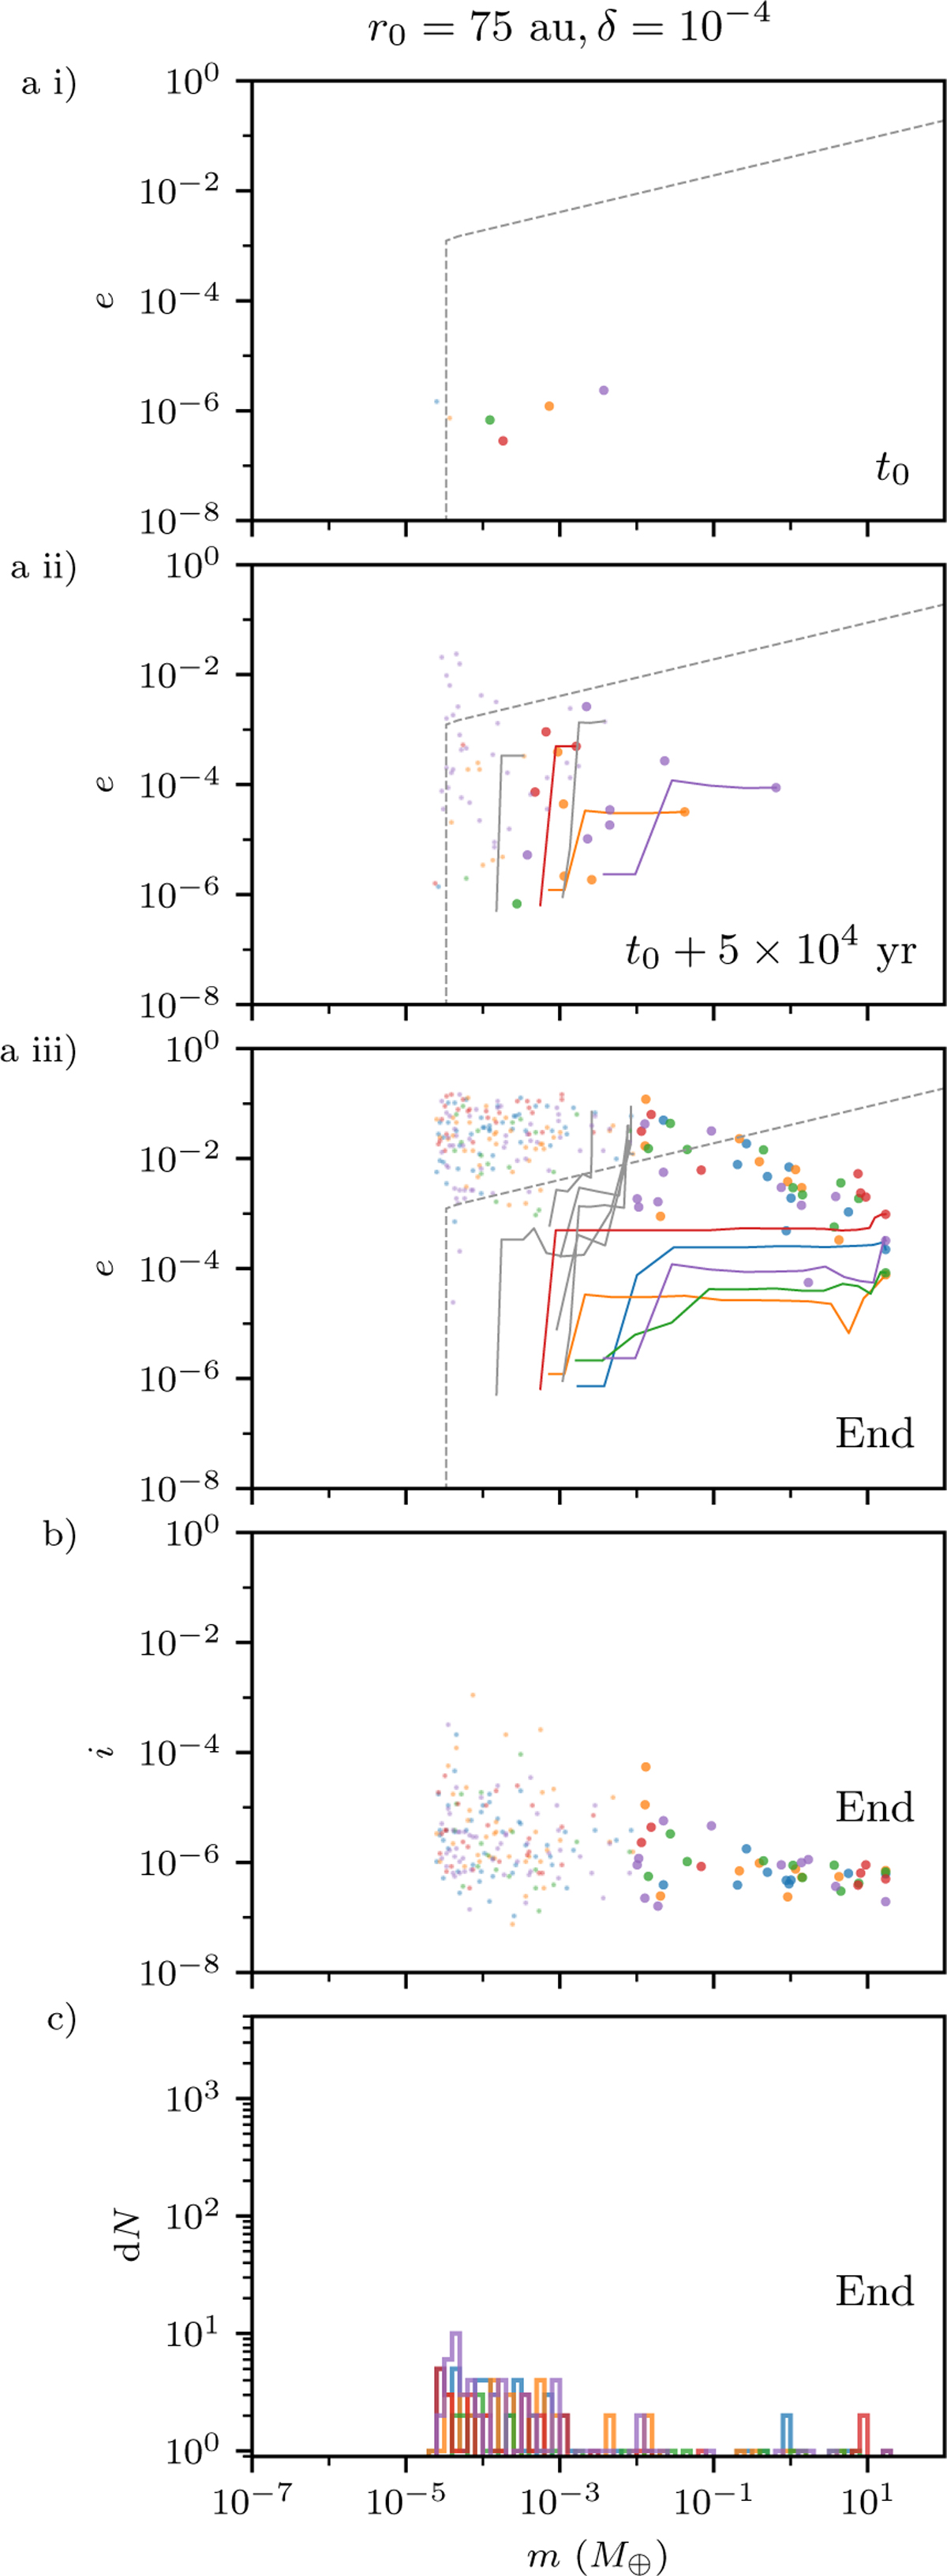
Further simulation results for the disc gap at 75 au and δ = 10−4. (a) e-m time sequence, showing that a small number of massive cores are formed, which excite and prevent the growth of the latecomers. This is similar to the results to the case with r0 = 10 au and δ = 10−4. (b) i-m plot at the end of the simulations, showing that the inclinations remain very low for all bodies, i.e. around the values drawn at their formation, (c) Differential mass distribution at the end also shows only a small number of massive cores are formed and the simulations are stopped before a large population of planetesimals is produced. This is also similar to the case with r0 = 10 au and δ = 10−4.
Current usage metrics show cumulative count of Article Views (full-text article views including HTML views, PDF and ePub downloads, according to the available data) and Abstracts Views on Vision4Press platform.
Data correspond to usage on the plateform after 2015. The current usage metrics is available 48-96 hours after online publication and is updated daily on week days.
Initial download of the metrics may take a while.