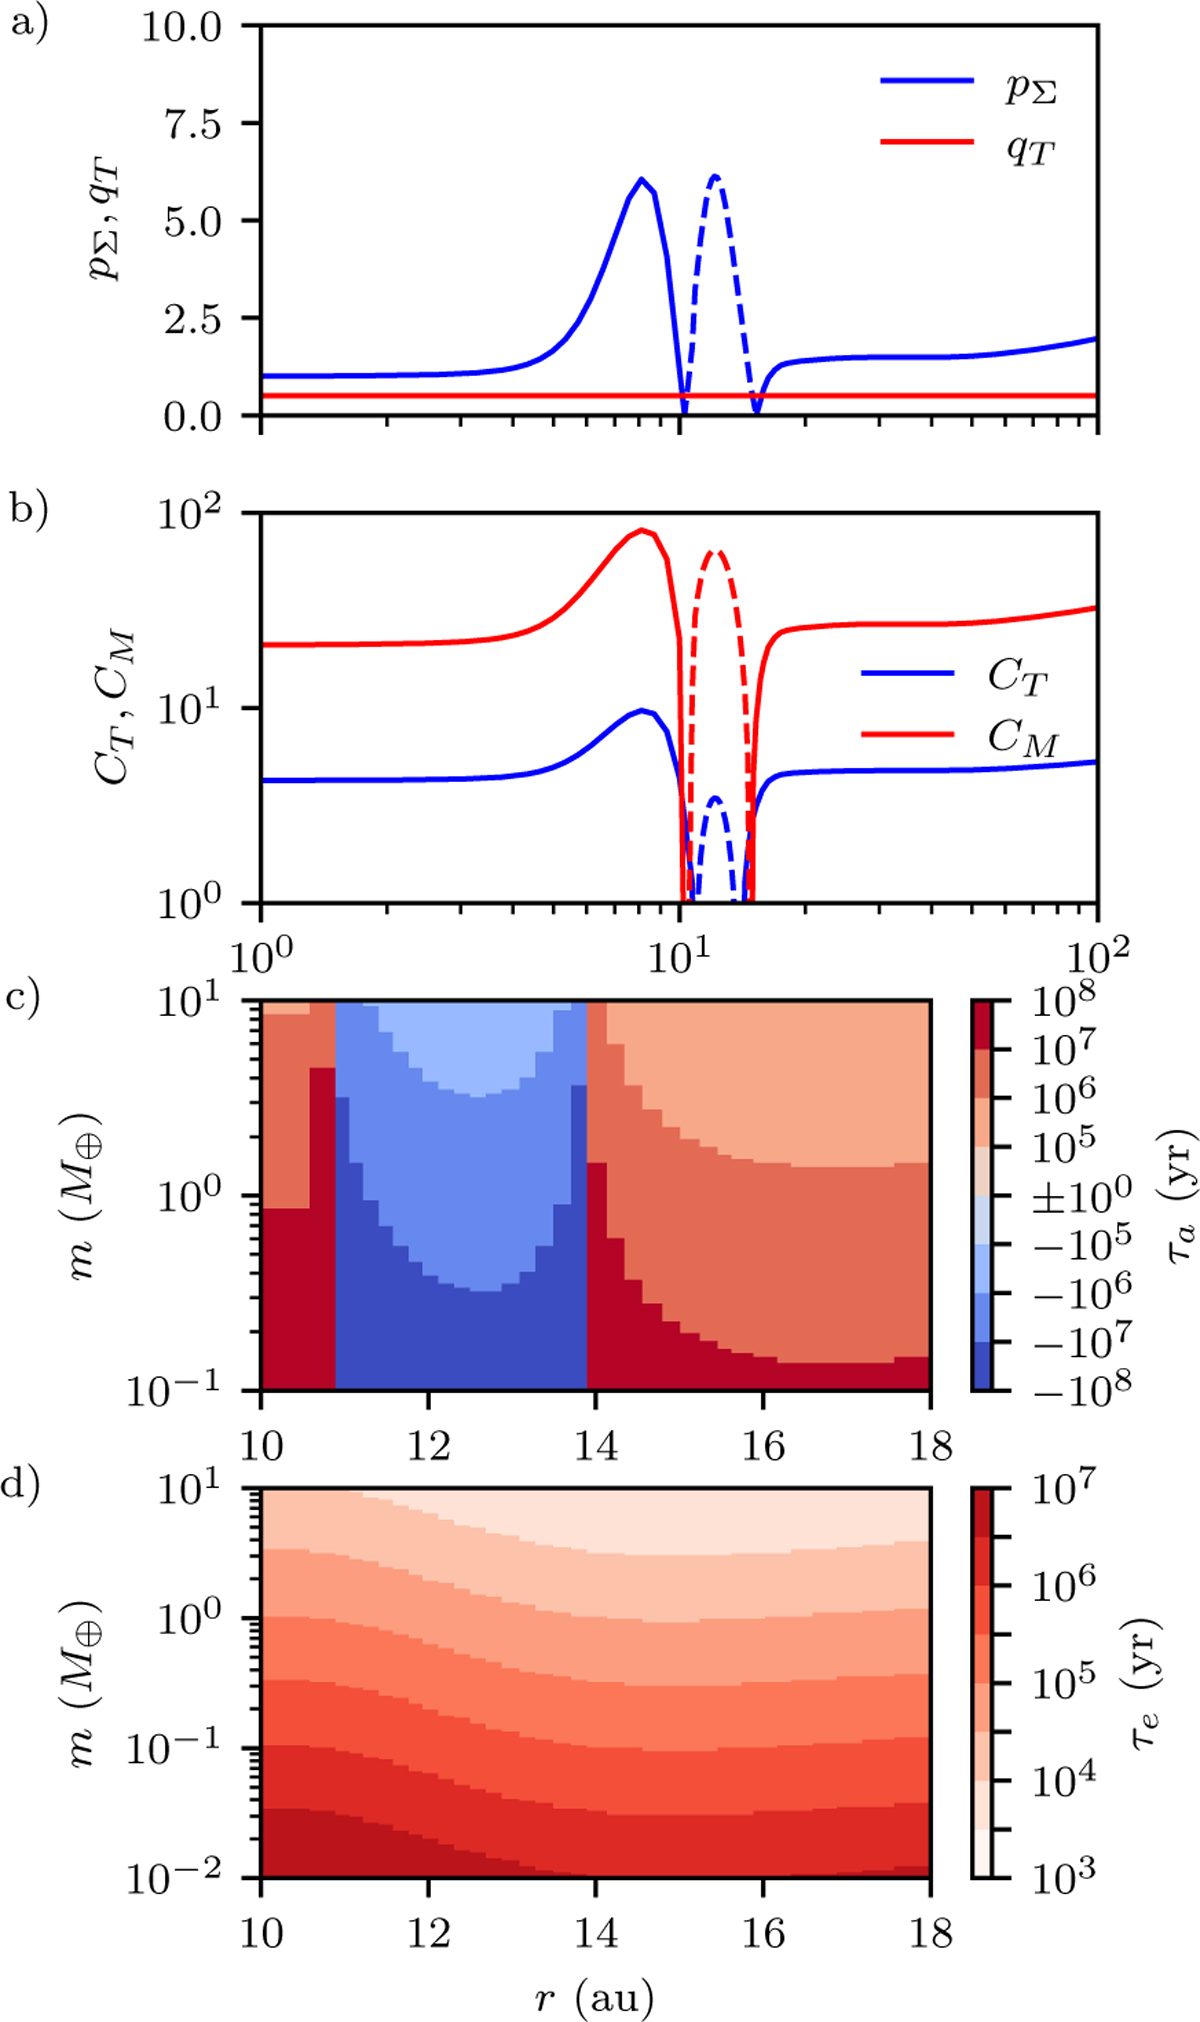
Fig. 10
Download original image
Radial profiles of the migration-related parameters at the end of one of the simulations with r0 = 10 au. (a) qT remains constant in our disc model, while p∑ varies greatly and changes sign across the pressure bump. (b) Coefficients for τa also change sign but at slightly different locations according to Eqs. (24) and (25), respectively. (c) τa near the pressure bump for embryos of different masses with e = 10−3 and i = e/2, where inward migration is denoted by red and outward migration is denoted by blue. The migration rate slows down and changes sign slightly interior (≈14 au) to the location of planetesimal formation (≈14.2 au). (d) τe at the same locations, which is ∝twav ∝ m−1. This shows type-I damping starts to become efficient when the embryos are ≳10−1 M⊕.
Current usage metrics show cumulative count of Article Views (full-text article views including HTML views, PDF and ePub downloads, according to the available data) and Abstracts Views on Vision4Press platform.
Data correspond to usage on the plateform after 2015. The current usage metrics is available 48-96 hours after online publication and is updated daily on week days.
Initial download of the metrics may take a while.