Fig. 11
Download original image
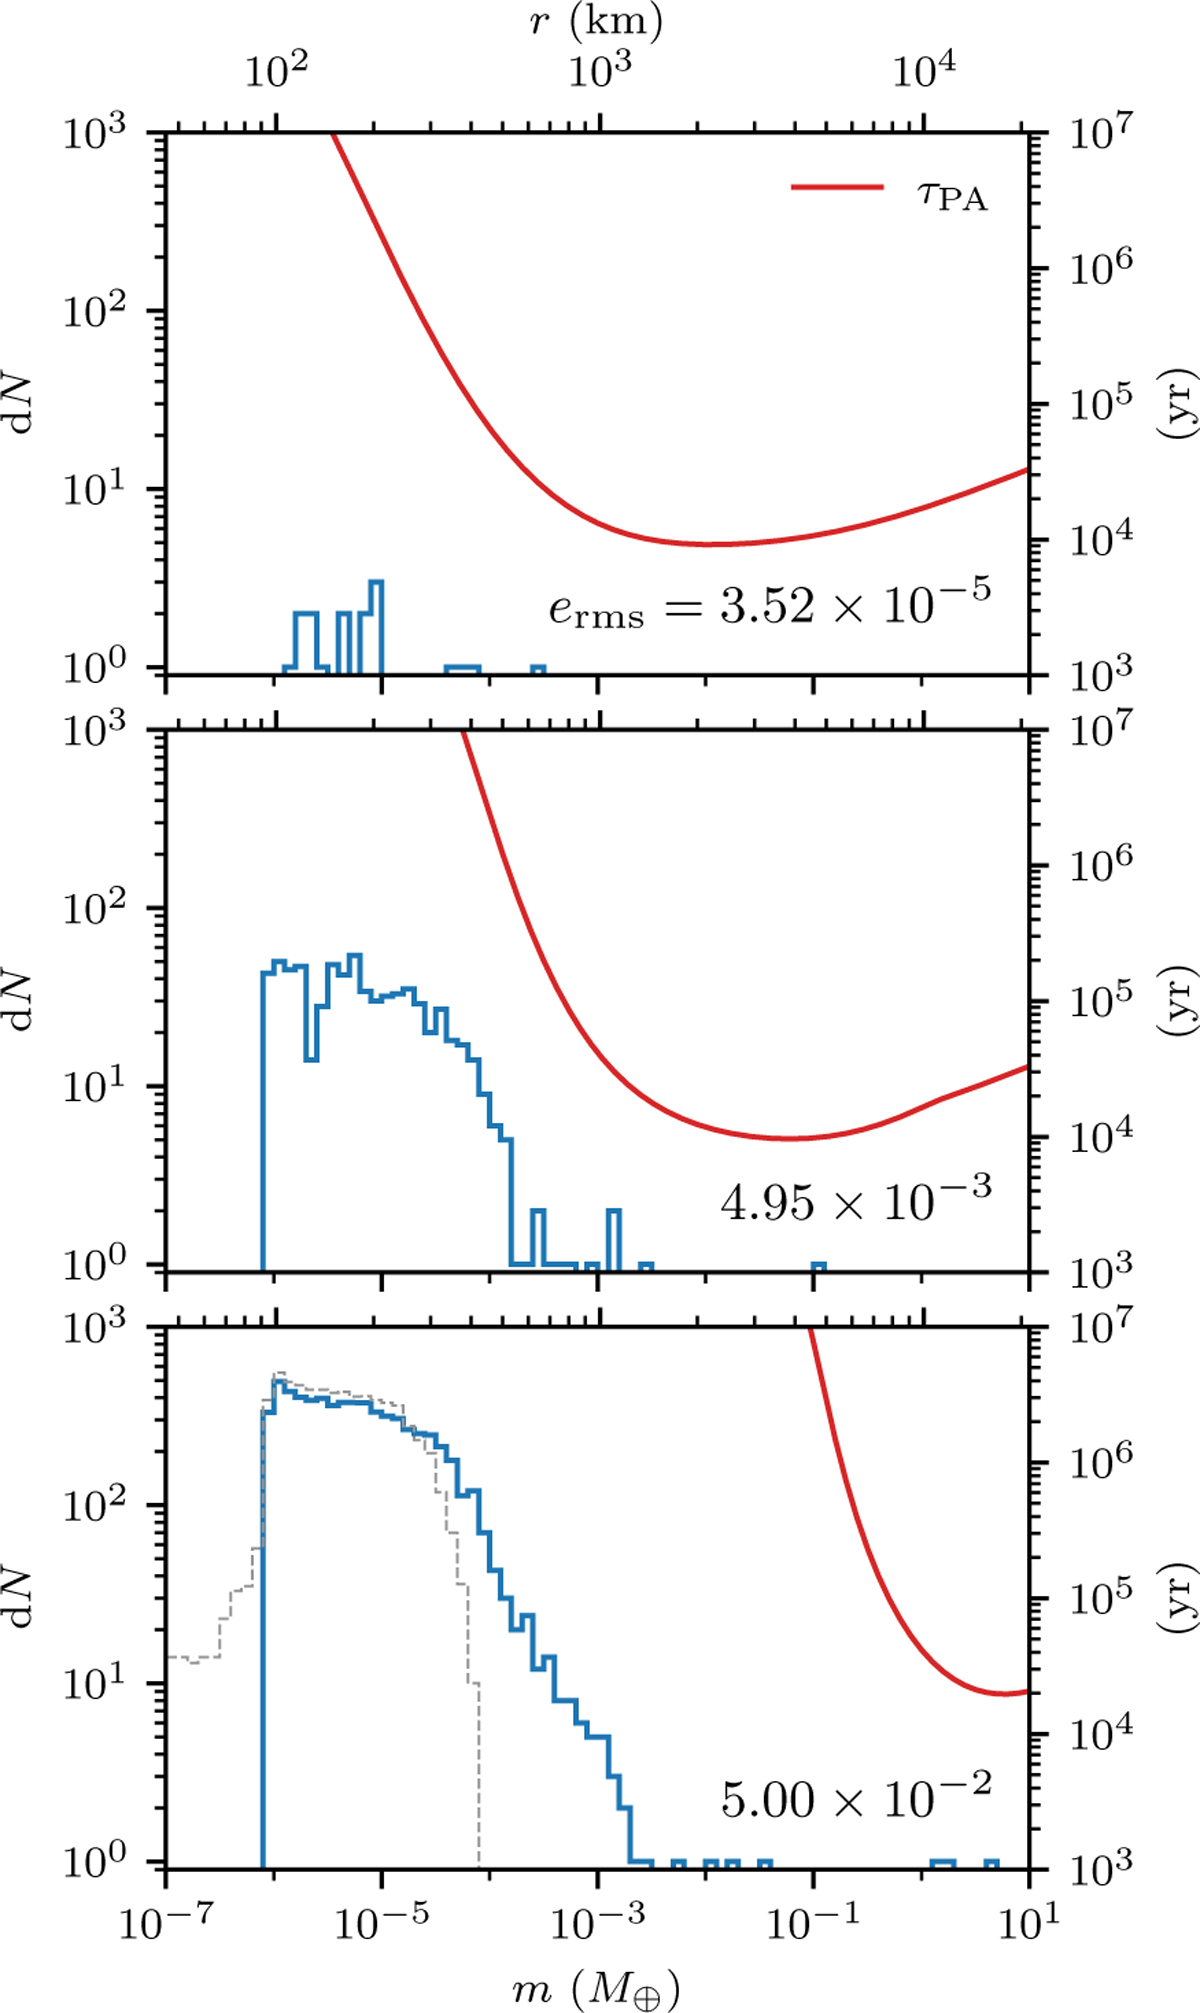
Differential mass distribution from one of the simulations with r0 = 10 au and δ = 10−5 at t0 + 5 × 10⁴ yr (top), t0 + 2 × 10⁵ yr (middle), and t0 + 3.7 × 10⁵ yr (bottom) with ten mass bins in each decade. The red line in each panel shows the corresponding estimation of the pebble accretion timescale τPA with respect to mass for the instantaneous erms of all bodies. The grey histogram in the bottom panel shows the initial mass of all planetesimals produced throughout the simulation. The evolution shows a window period exists where significant growth by pebble accretion is possible. This period starts from the time of the formation of the first planetesimal with m > MPA,hw and ends at the time when it becomes massive enough to excite the less massive bodies to high eccentricity in a short timescale.
Current usage metrics show cumulative count of Article Views (full-text article views including HTML views, PDF and ePub downloads, according to the available data) and Abstracts Views on Vision4Press platform.
Data correspond to usage on the plateform after 2015. The current usage metrics is available 48-96 hours after online publication and is updated daily on week days.
Initial download of the metrics may take a while.