Fig. 9
Download original image
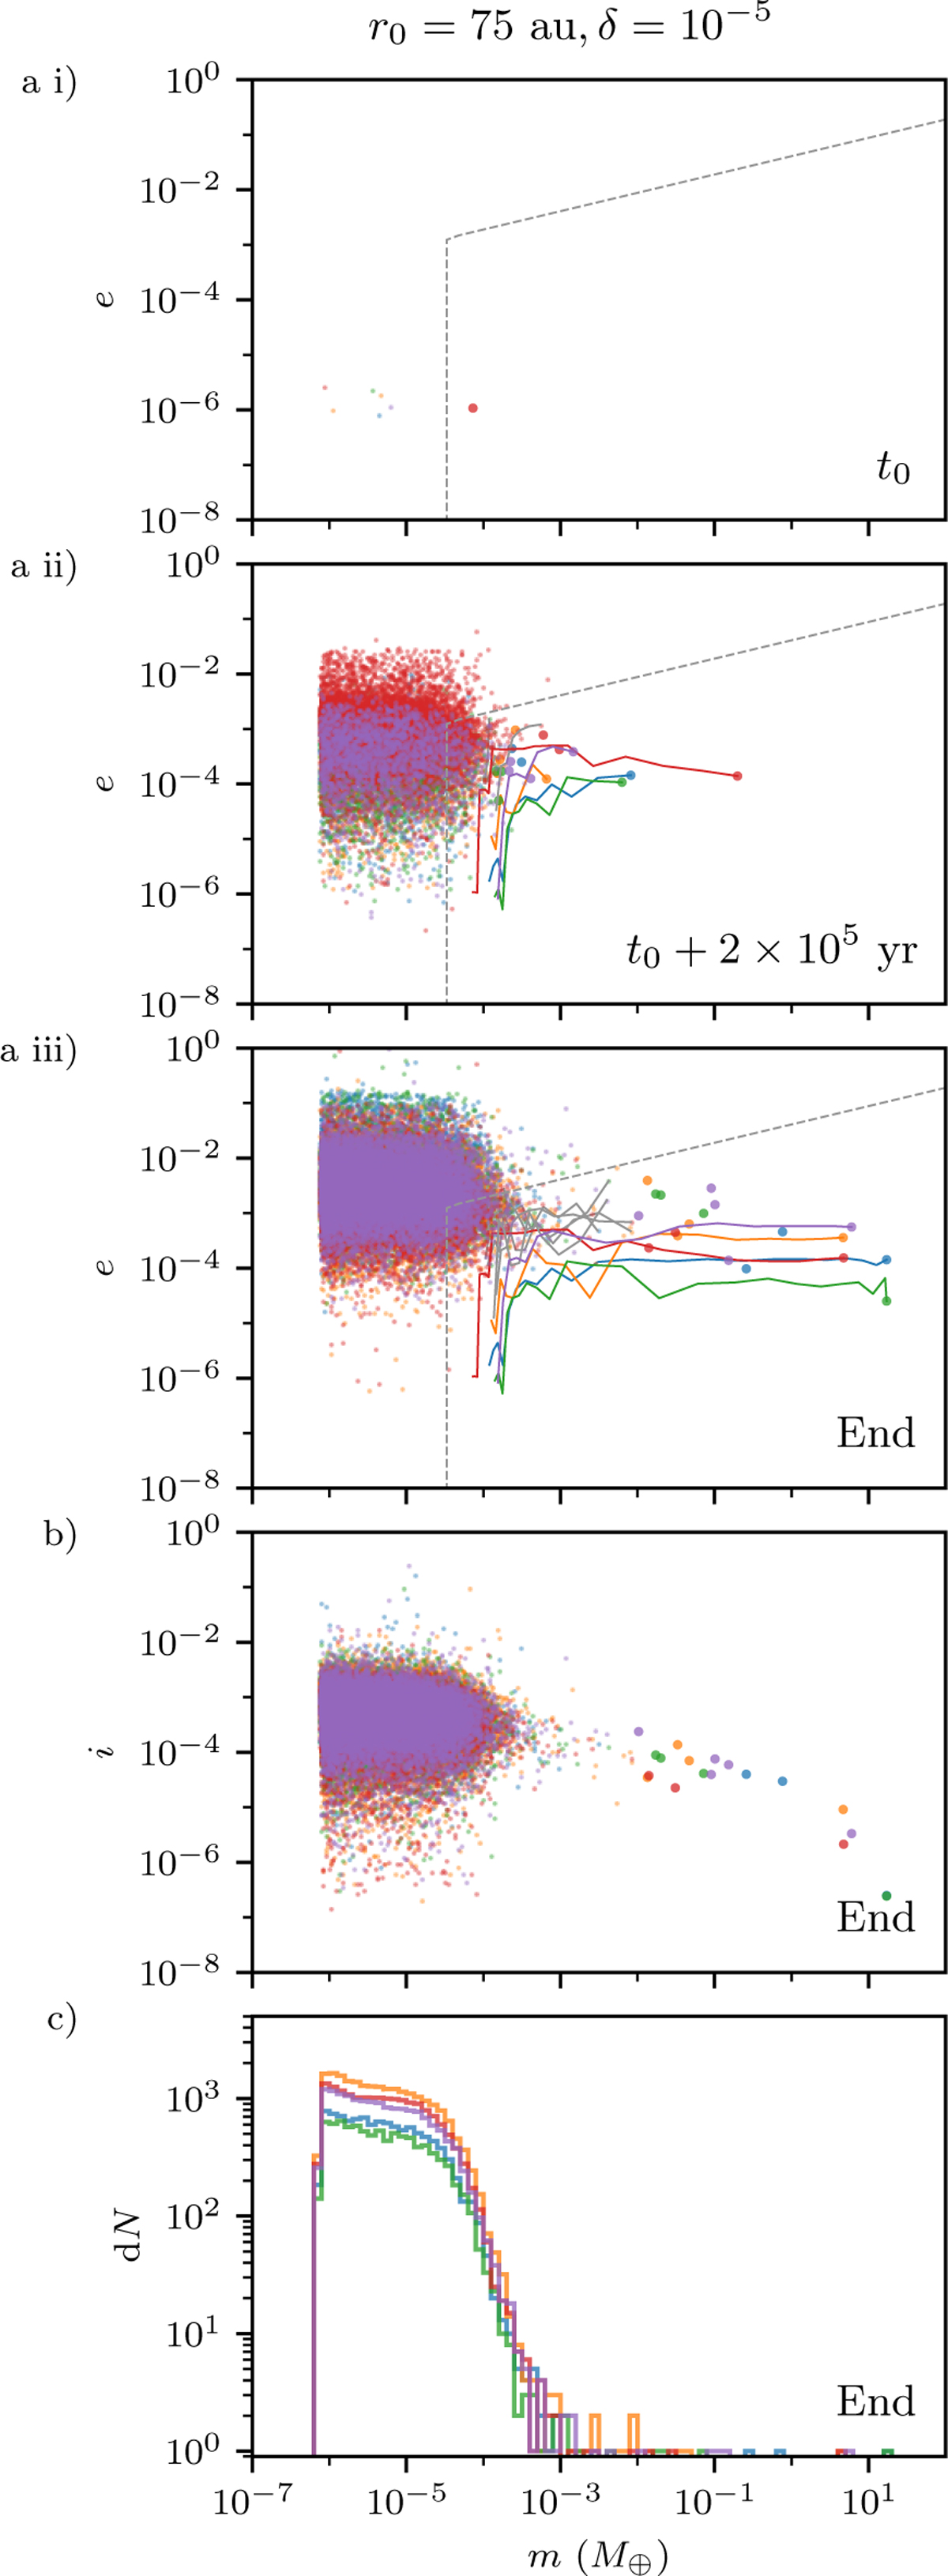
Simulation results for the disc gap at 75 au and δ = 10−5, which ended from t0 + 2.4 × 10⁵ to t0 + 3.1 × 10⁵ yr. (a) e-m time sequence, showing that a small number of massive embryos started growth early and stirred the majority of the late-forming planetesimals into eccentric orbits, (b) i-m plot at the end of the simulations, showing that the i of all bodies remains far lower than the pebble disc scale height and confirms that the pebble relative velocity is critical, (c) Compared to the case of r0 = 10 au and δ = 10−5, the differential mass distribution shows an even smaller number of massive cores formed in these simulations.
Current usage metrics show cumulative count of Article Views (full-text article views including HTML views, PDF and ePub downloads, according to the available data) and Abstracts Views on Vision4Press platform.
Data correspond to usage on the plateform after 2015. The current usage metrics is available 48-96 hours after online publication and is updated daily on week days.
Initial download of the metrics may take a while.