Fig. 5
Download original image
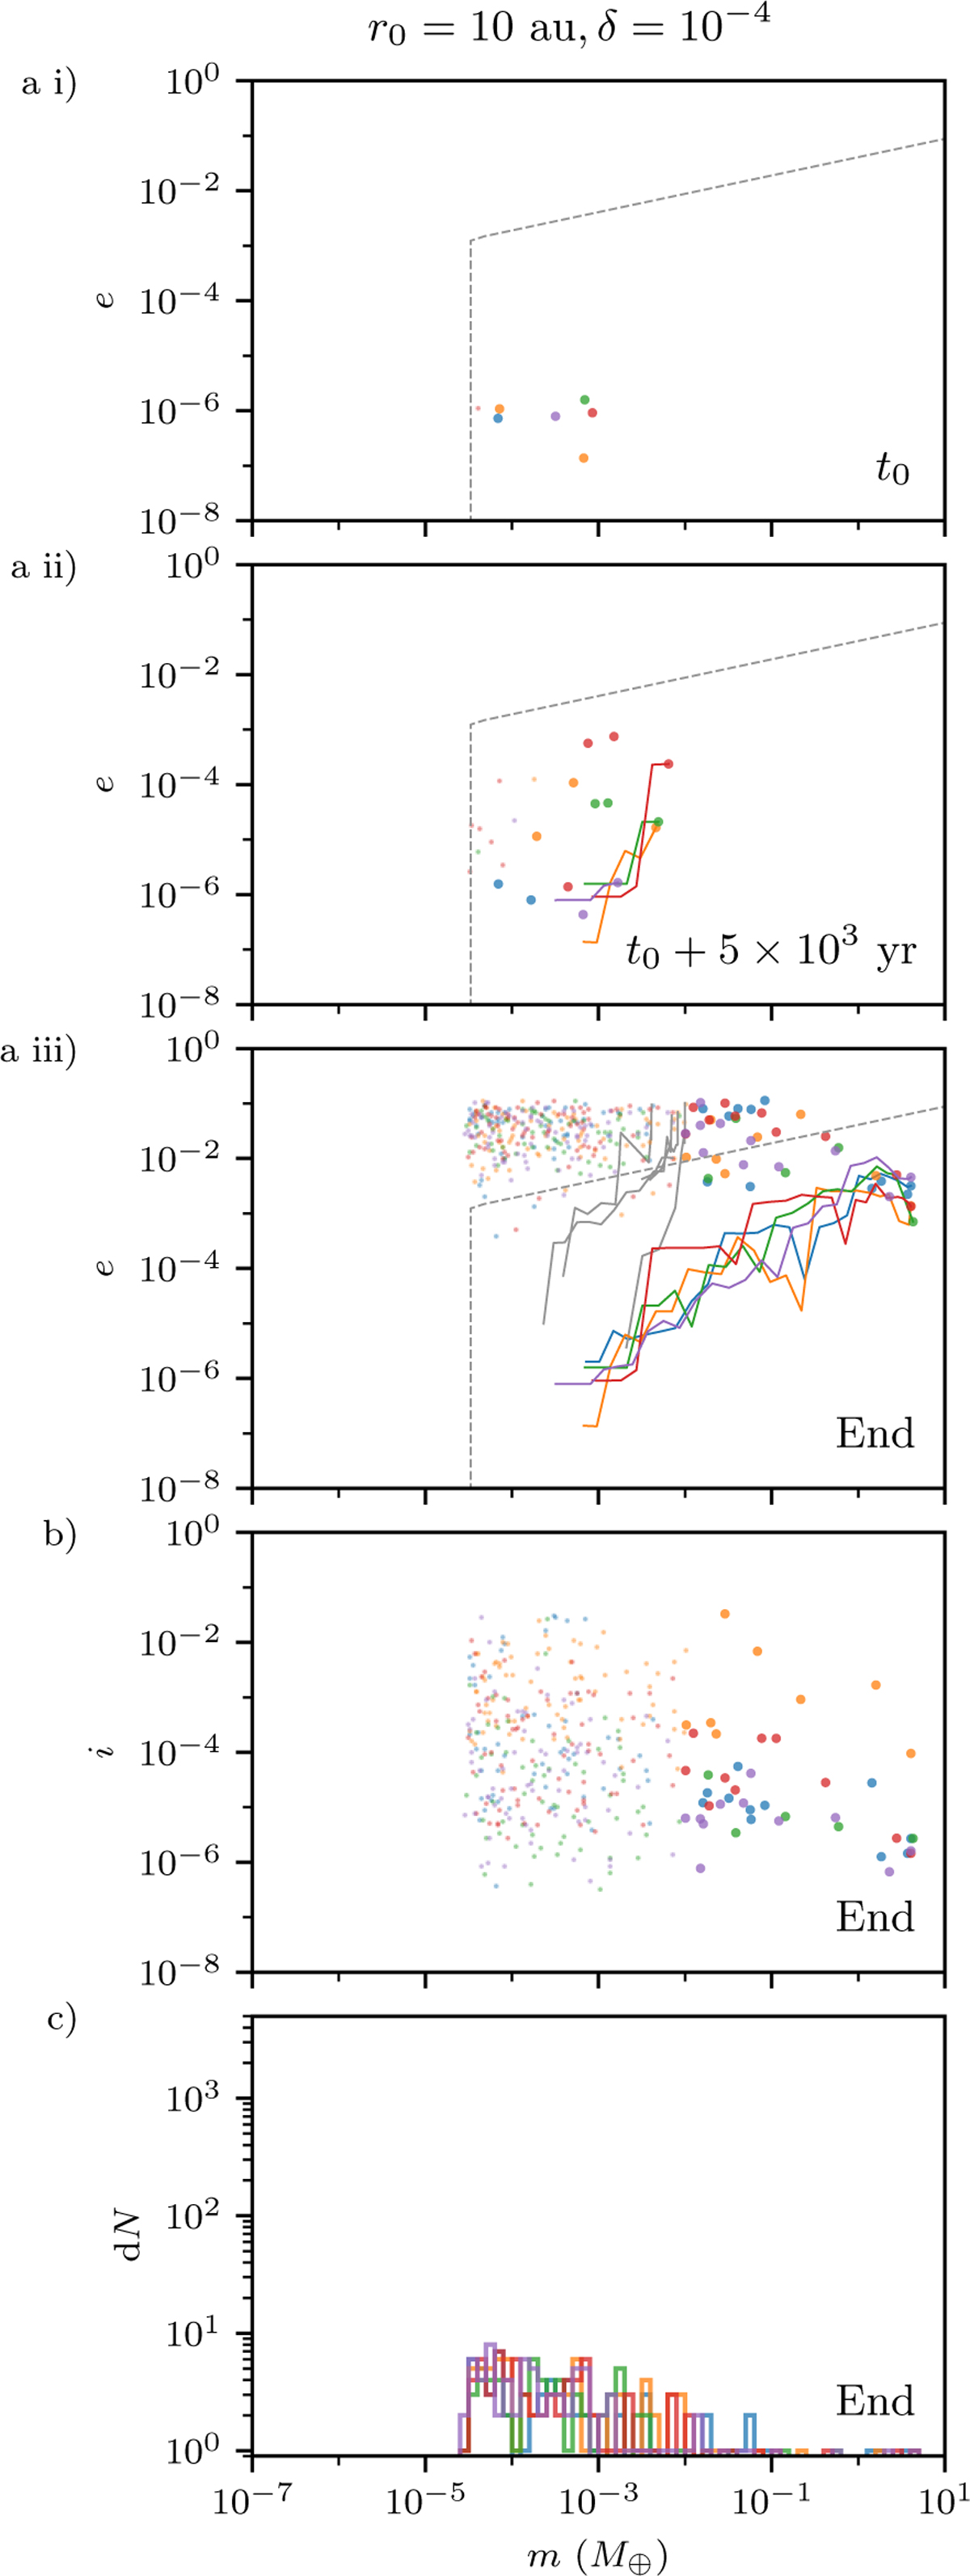
Further simulation results for the disc gap at 10 au and δ = 10−4. (a) Time sequence of planetesimal eccentricity e and mass m. The coloured trajectories follow the most massive bodies and the grey trajectories follow the most massive ones under 10−2 M⊕ in each of the simulations. The dashed lines denote the pebble accretion onset mass discussed in Sect. 4.2. (b) Planetesimal inclination i and mass m at the end, where the i of most bodies is still lower than the pebble disc scale height, (c) Differential mass distribution at the end of the model with ten mass bins in each decade. This shows that only a few massive cores are formed while the simulations stop before a large population of planetesimals is formed.
Current usage metrics show cumulative count of Article Views (full-text article views including HTML views, PDF and ePub downloads, according to the available data) and Abstracts Views on Vision4Press platform.
Data correspond to usage on the plateform after 2015. The current usage metrics is available 48-96 hours after online publication and is updated daily on week days.
Initial download of the metrics may take a while.