Fig. 4
Download original image
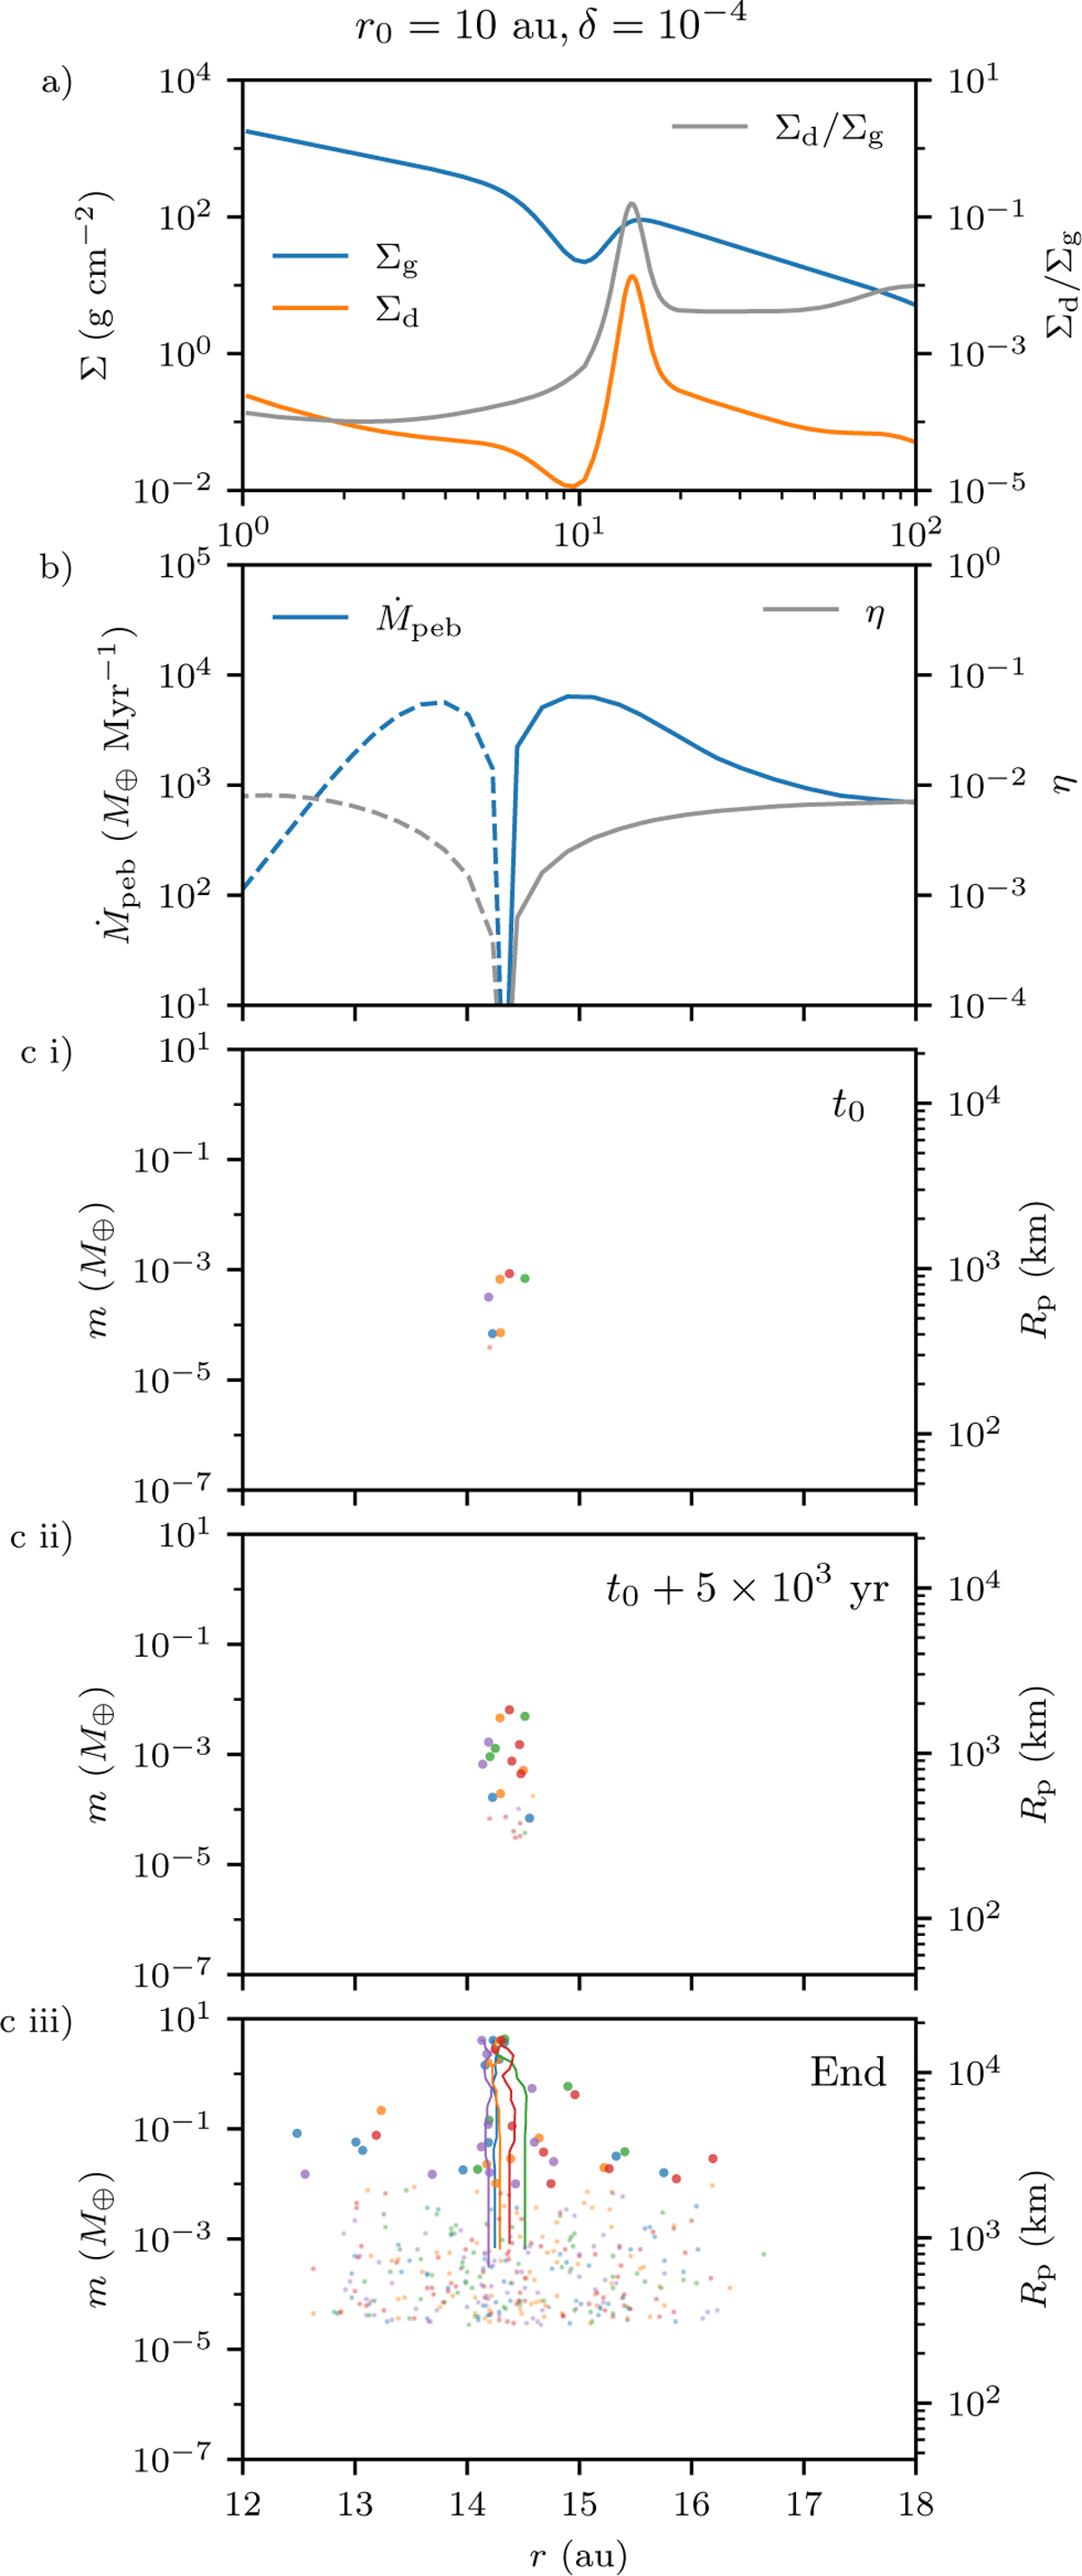
Simulation results for the disk gap at 10 au and δ = 10−4, where MG ≈ 3 × 10⁻³M⊕. (a) Radial profiles in one of the five simulations of the dust and gas surface densities as well as the dust-to-gas ratio at t0 when planetesimal formation starts, (b) Pebble flux ![]() and the pressure support parameter η around the pressure bump from one of the five simulations, where the dashed lines denote negative values, (c) Time sequence of mass m and semi-major axis r of the planetesimals. Planetesimals that reach 10−2 M⊕ by the end are denoted with large dots. Each colour shows one of the five simulations, which ended from t0 + 2.2 × 10⁴ to t0 + 3.4 × 10⁴ yr. Further descriptions are provided in the text.
and the pressure support parameter η around the pressure bump from one of the five simulations, where the dashed lines denote negative values, (c) Time sequence of mass m and semi-major axis r of the planetesimals. Planetesimals that reach 10−2 M⊕ by the end are denoted with large dots. Each colour shows one of the five simulations, which ended from t0 + 2.2 × 10⁴ to t0 + 3.4 × 10⁴ yr. Further descriptions are provided in the text.
Current usage metrics show cumulative count of Article Views (full-text article views including HTML views, PDF and ePub downloads, according to the available data) and Abstracts Views on Vision4Press platform.
Data correspond to usage on the plateform after 2015. The current usage metrics is available 48-96 hours after online publication and is updated daily on week days.
Initial download of the metrics may take a while.