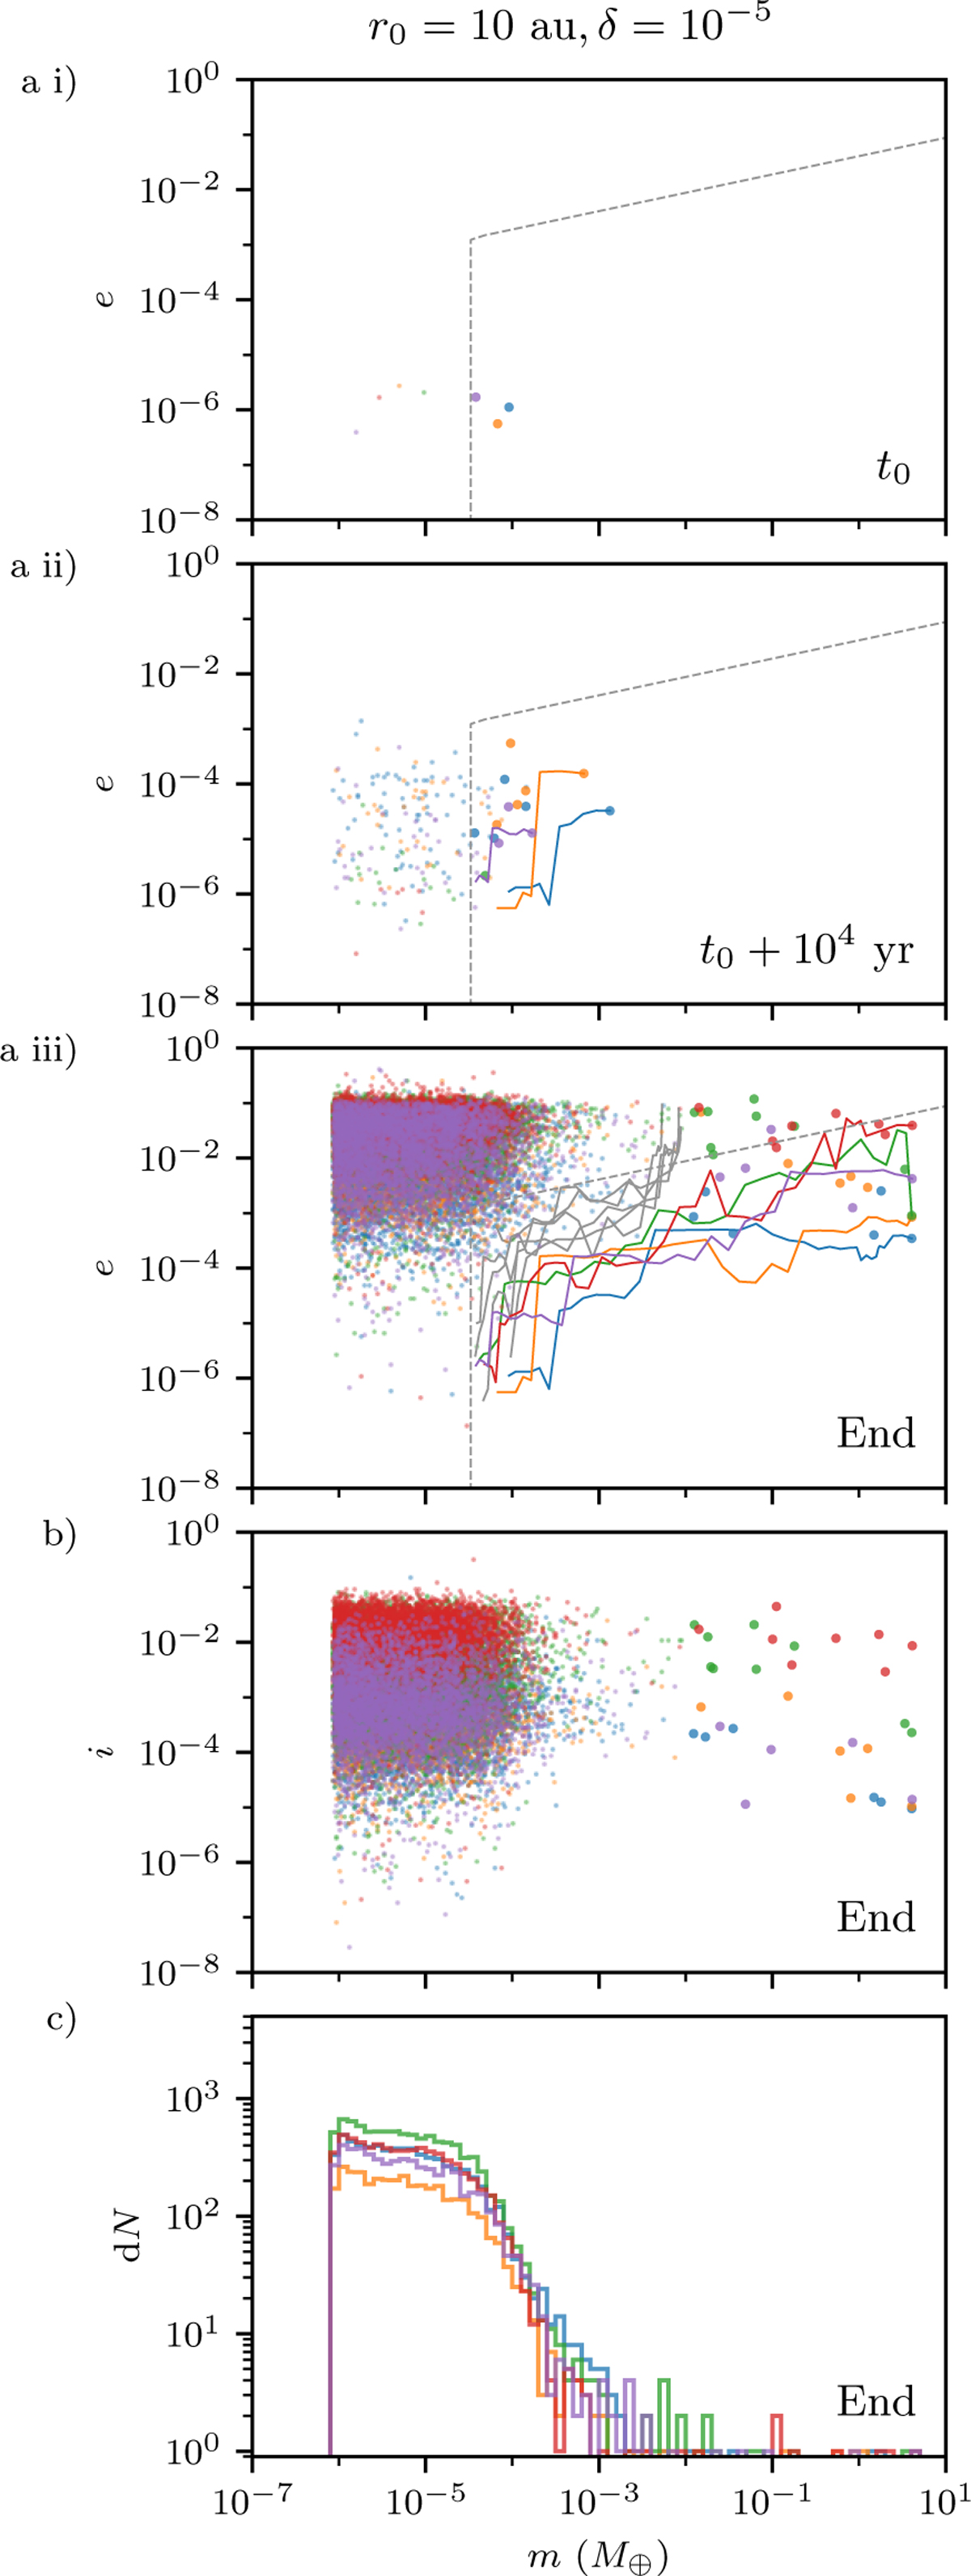
Fig. 6
Download original image
Simulation results for the disc gap at 10 au and δ = 10−5, which ended from t0 + 3.4 × 10⁴ to t0 + 5.1 × 10⁴ yr. (a) e-m time sequence, showing that only the planetesimals formed early and relatively massive can accrete pebbles efficiently and stir up the latecomers, (b) i-m plot at the end of the simulations, showing that the inclinations of the small planetesimals are still not significantly larger than the pebble disc scale height, (c) Differential mass distribution at the end, showing that the majority of the planetesimals do not grow significantly by pebble accretion and retain the form of the initial mass distribution as shown in Fig. 1. Only a small number of massive cores are formed in the simulations.
Current usage metrics show cumulative count of Article Views (full-text article views including HTML views, PDF and ePub downloads, according to the available data) and Abstracts Views on Vision4Press platform.
Data correspond to usage on the plateform after 2015. The current usage metrics is available 48-96 hours after online publication and is updated daily on week days.
Initial download of the metrics may take a while.