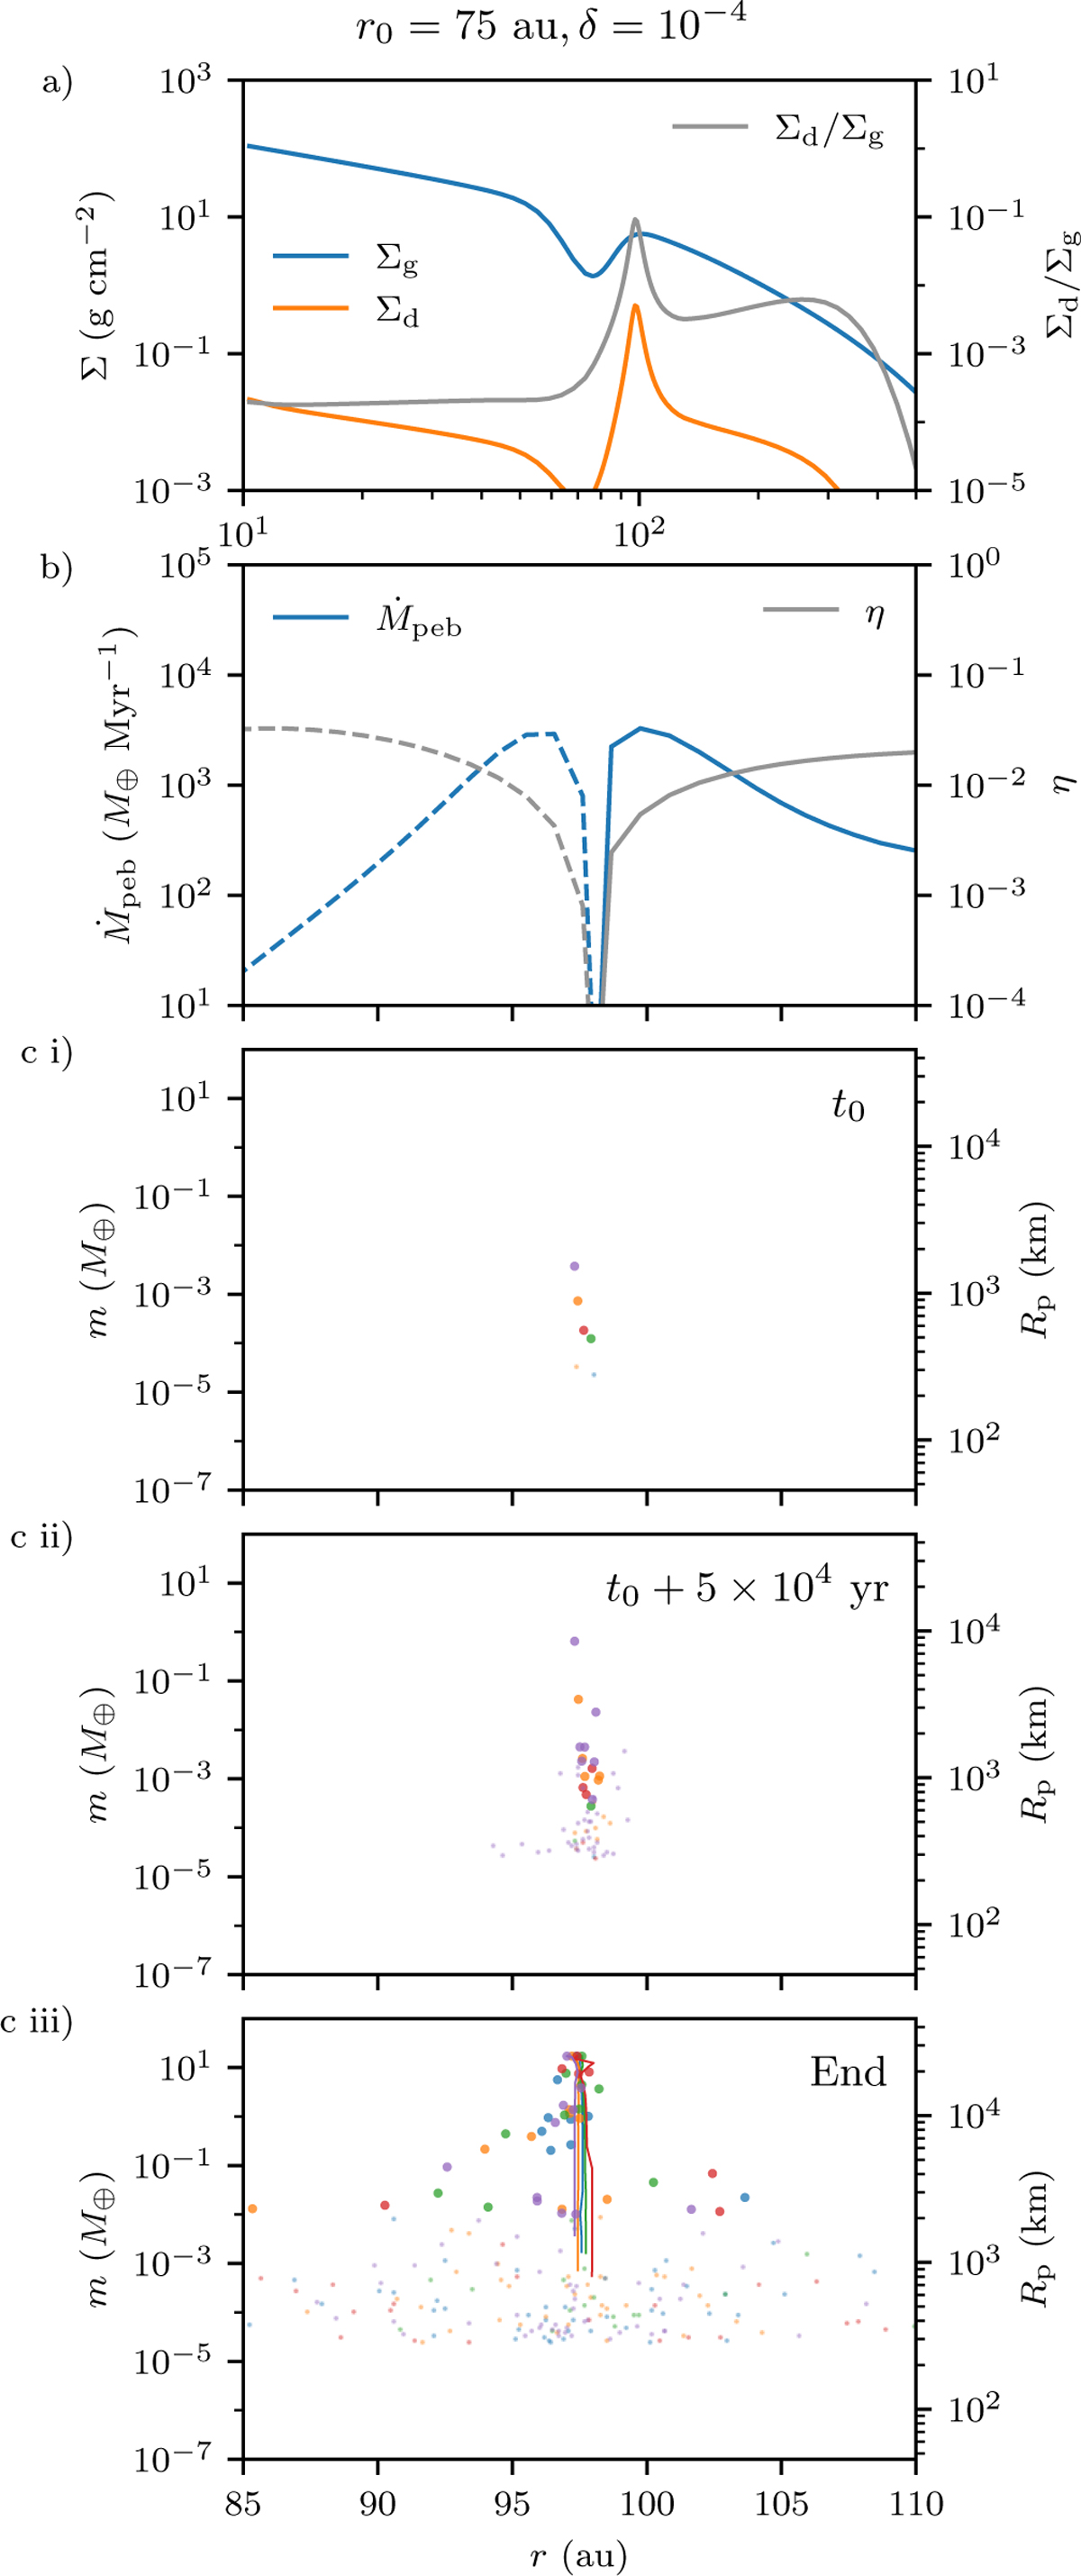
Fig. 7
Download original image
Simulation results for the disc gap at 75 au and δ = 10−4. (a) The radial profiles of the disc when planetesimal formation starts, (b) Radial profiles of pebble flux Ṁpeb showing that it is still high around the pressure bump, yet slightly lower compared to the models at 10 au shown in Fig. 4b. The pressure support parameter η is generally a few times higher while the regions of low η still coincide with the peaks of the pebble flux, (c) m-r time sequence, showing similar results except the planetesimals are formed later and the growth rate is slower. The five simulations ended from t0 + 1.2 × 10⁵ to t0 + 2.2 × 10⁵ yr.
Current usage metrics show cumulative count of Article Views (full-text article views including HTML views, PDF and ePub downloads, according to the available data) and Abstracts Views on Vision4Press platform.
Data correspond to usage on the plateform after 2015. The current usage metrics is available 48-96 hours after online publication and is updated daily on week days.
Initial download of the metrics may take a while.