Fig. 3
Download original image
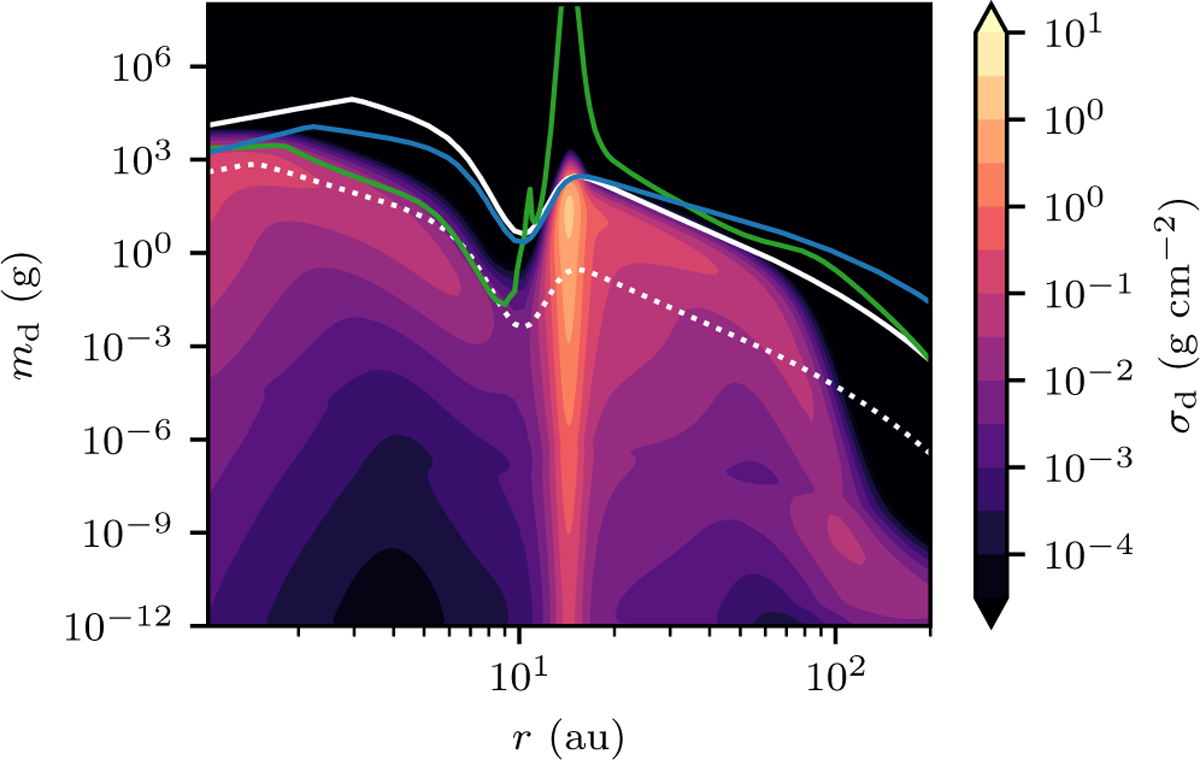
Dust distribution at t0 of one of the five simulations for the disc gap at 10 au and δ = 10−4. The heat map shows the radial profile of the midplane dust density σd for different dust mass md. The white lines show the md corresponding to St = 0.1 (solid) and 0.01 (dotted), respectively. The green and blue lines show the drift and the fragmentation limits, respectively. The dust mass is shown to be limited by the fragmentation limit (≫mm) at the dust trap near 14 au.
Current usage metrics show cumulative count of Article Views (full-text article views including HTML views, PDF and ePub downloads, according to the available data) and Abstracts Views on Vision4Press platform.
Data correspond to usage on the plateform after 2015. The current usage metrics is available 48-96 hours after online publication and is updated daily on week days.
Initial download of the metrics may take a while.