| Issue |
A&A
Volume 654, October 2021
|
|
|---|---|---|
| Article Number | A165 | |
| Number of page(s) | 19 | |
| Section | Extragalactic astronomy | |
| DOI | https://doi.org/10.1051/0004-6361/202141417 | |
| Published online | 27 October 2021 | |
The effect of active galactic nuclei on the cold interstellar medium in distant star-forming galaxies⋆
1
Cosmic Dawn Center (DAWN), Denmark
e-mail: This email address is being protected from spambots. You need JavaScript enabled to view it.
2
Niels Bohr Institute, University of Copenhagen, Jagtvej 128, 2200 Copenhagen N, Denmark
3
AIM, CEA, CNRS, Université Paris-Saclay, Université Paris Diderot, Sorbonne Paris Cité, 91191 Gif-sur-Yvette, France
4
Center for Extragalactic Astronomy, Durham University, South Road, Durham DH1 3LE, UK
5
DTU-Space, Technical University of Denmark, Elektrovej 327, 2800 Kgs. Lyngby, Denmark
6
Institute for Astronomy, Astrophysics, Space Applications and Remote Sensing, National Observatory of Athens, 15236 Athens, Greece
7
Max Planck Institute for Extraterrestrial Physics (MPE), Giessenbachstr. 1, 85748 Garching, Germany
8
Korea Astronomy and Space Science Institute, 776 Daedeokdae-ro, 34055 Daejeon, Republic of Korea
9
Institut de Radioastronomie Millimétrique (IRAM), 300 Rue de la Piscine, 38400 Saint-Martin-d’Hères, France
10
Department of Physics & Astronomy, University College London, Gower Street, London WC1E 6BT, UK
11
INAF – Osservatorio Astronomico di Brera, Via Brera 28, 20121 Milano, Italy
12
Department of Physics and Astronomy, The University of Sheffield, Hounsfield Road, Sheffield S3 7RH, UK
13
Department of Astronomy, Xiamen University, Xiamen, Fujian 361005, PR China
14
Purple Mountain Observatory & Key Laboratory for Radio Astronomy, Chinese Academy of Sciences, 10 Yuanhua Road, Nanjing 210033, PR China
15
Instituto de Física, Pontificia Universidad Católica de Valparaíso, Casilla, 4059 Valparaíso, Chile
16
Núcleo de Astronomía, Facultad de Ingeniería y Ciencias, Universidad Diego Portales, Av. Ejército 441, Santiago, Chile
17
Instituto de Astrofísica de Canarias (IAC), 38205 La Laguna, Tenerife, Spain
18
Universidad de La Laguna, Dpto. Astrofísica, 38206 La Laguna, Tenerife, Spain
19
Kavli Institute for the Physics and Mathematics of the Universe (Kavli-IPMU, WPI), The University of Tokyo Institutes for Advanced Study, The University of Tokyo, 5-1-5 Kashiwanoha, Kashiwa, Chiba 277-8583, Japan
20
Department of Astronomy, School of Science, The University of Tokyo, 7-3-1 Hongo, Bunkyo-ku, Tokyo 113-0033, Japan
Received:
28
May
2021
Accepted:
28
August
2021
Abstract
In the framework of a systematic study with the ALMA interferometer of IR-selected main-sequence and starburst galaxies at z ∼ 1 − 1.7 at typical ∼1″ resolution, we report on the effects of mid-IR- and X-ray-detected active galactic nuclei (AGN) on the reservoirs and excitation of molecular gas in a sample of 55 objects. We find widespread detectable nuclear activity in ∼30% of the sample. The presence of dusty tori influences the IR spectral energy distribution of galaxies, as highlighted by the strong correlation among the AGN contribution to the total IR luminosity budget (fAGN = LIR, AGN/LIR), its hard X-ray emission, and the Rayleigh-Jeans to mid-IR (S1.2 mm/S24 μm) observed color, with evident consequences on the ensuing empirical star formation rate estimates. Nevertheless, we find only marginal effects of the presence and strength of AGN on the carbon monoxide CO (J = 2, 4, 5, 7) or neutral carbon ([C I](3P1 − 3P0), [C I](3P2 − 3P1)) line luminosities and on the derived molecular gas excitation as gauged by line ratios and the full spectral line energy distributions. The [C I] and CO emission up to J = 5, 7 thus primarily traces the properties of the host in typical IR luminous galaxies. However, our analysis highlights the existence of a large variety of line luminosities and ratios despite the homogeneous selection. In particular, we find a sparse group of AGN-dominated sources with the highest LIR, AGN/LIR, SFR ratios, ≳3, that are more luminous in CO (5−4) than what is predicted by the L′CO(5-4)−LIR, SFR relation, which might be the result of the nuclear activity. For the general population, our findings translate into AGN having minimal effects on quantities such as gas and dust fractions and star formation efficiencies. If anything, we find hints of a marginal tendency of AGN hosts to be compact at far-IR wavelengths and to display 1.8 times larger dust optical depths. In general, this is consistent with a marginal impact of the nuclear activity on the gas reservoirs and star formation in average star-forming AGN hosts with LIR > 5 × 10¹¹ L⊙, typically underrepresented in surveys of quasars and submillimeter galaxies.
Key words: galaxies: evolution / galaxies: ISM / galaxies: starburst / galaxies: active / galaxies: high-redshift / submillimeter: ISM
Data are only available at the CDS via anonymous ftp to cdsarc.u-strasbg.fr (130.79.128.5) or via http://cdsarc.u-strasbg.fr/viz-bin/cat/J/A+A/654/A165
© ESO 2021
1. Introduction
The role of super-massive black holes (SMBHs) in the evolution of their host galaxies is a topic of major debate in extragalactic astrophysics (see Harrison 2017 for a recent review). The empirical correlations among several properties of SMBHs and of their hosts suggest a tightly intertwined evolution, which has its physical roots in the mechanisms that trigger their growth. From a theoretical standpoint, the phases of active growth of SMBHs – shining as active galactic nuclei (AGN) – are regarded as primary regulators of the hosts’ growth and a viable mechanism to completely quench the star formation (e.g., Croton et al. 2006; Hopkins et al. 2006). This might happen via the expulsion of a significant portion of the cold gas reservoirs via powerful winds or by heating the interstellar medium (ISM) and the intergalactic medium, preventing further gas collapse and accretion (“negative feedback”). Interestingly, the same AGN-driven outflows might compress the surrounding gas and stimulate, rather than suppress, the star formation in the host (“positive feedback”, e.g., Silk 2013). It is, thus, evident that the study of star formation in galaxies, cold gas reservoirs, and their physical conditions has a central role in this context. However, establishing a causality nexus between the AGN activity and the galaxy growth or quenching has turned out to be a significant challenge owing to the widely different time and spatial scales involved in the development of SMBHs and their hosts, population selection biases, the sparsity of the available samples, and the truly multivariate nature of this problem, as different processes concur to explain common sets of observables.
As an example, observational signatures of high-velocity and multiphase outflows launched by AGN have been reported in the local and distant Universe (e.g., Cicone et al. 2014, 2018; Förster Schreiber et al. 2014; Feruglio et al. 2015; Harrison et al. 2015; Jarvis et al. 2019; Veilleux et al. 2020), and so have pockets of warm and dense gas in AGN hosts (e.g., Weiß et al. 2007; van der Werf et al. 2010; Mashian et al. 2015; Carniani et al. 2019). Nevertheless, there is no clear evidence of strong feedback on the cold gaseous and dusty ISM in sizable samples of local galaxies, with AGN hosts showing similar global properties to purely star-forming galaxies (Saintonge et al. 2012; Shangguan et al. 2020; Jarvis et al. 2020; Yesuf & Ho 2020). At high redshifts the situation is more controversial. Past studies particularly focused on the lowest accessible carbon monoxide (CO) transitions and long-wavelength dust emission in order to constrain the total molecular gas mass across different galaxy types. A great effort has been undertaken to characterize the epoch of maximal growth of galaxies via star formation and subsequent quenching at z ∼ 1 − 3, when the cosmic SMBH accretion rate peaked (Delvecchio et al. 2020). This resulted in claims of null effects of AGN on the star formation rates (SFRs; Stanley et al. 2017; Schulze et al. 2019) and the ISM properties of the host (Sharon et al. 2016; Kirkpatrick et al. 2019) or, at the opposite end, decreased gas fractions and shortened depletion timescales in the presence of AGN (Kakkad et al. 2017; Perna et al. 2018; Brusa et al. 2018; Circosta et al. 2021; Bischetti et al. 2021), disfavoring and supporting the existence of some kind of AGN feedback, respectively.
If the inferred total amount of molecular gas is disputed, even less is known about the gas excitation conditions in AGN hosts except for the brightest – and most biased – quasars or nearby (ultra-)luminous infrared galaxies ((U)LIRGs, Rosenberg et al. 2015). A better knowledge of the gas properties is highly desirable as it would have an immediate impact on the disparate conclusions about gas masses, fractions, and star formation efficiencies (SFEs) mentioned above, considering that an excitation correction is very frequently required to scale the observed mid- or high-J CO emission to the ground transition. Measurements of the CO spectral line energy distribution (SLED) of well-known powerful quasars (QSOs) at high redshift have revealed rather extreme luminosity ratios (e.g., Weiß et al. 2007; Carilli & Walter 2013; Bischetti et al. 2021) and detections of very high-J transitions (Gallerani et al. 2014; Carniani et al. 2019). However, it is not clear how different these ISM conditions are compared with the ones of starbursting submillimeter galaxies (SMGs; e.g., Bothwell et al. 2013; Spilker et al. 2014) generally observed at similar redshifts or at less extreme and more common AGN luminosities (Sharon et al. 2016; Kirkpatrick et al. 2019). Part of the confusion stems from the existence of several mechanisms able to similarly excite CO and produce rather flat SLEDs at high J, such as X-rays (Meijerink et al. 2007; van der Werf et al. 2010), mechanical heating (Rosenberg et al. 2015), shocks induced by mergers, radio jets, and supernova- or AGN-driven outflows (Kamenetzky et al. 2016; Carniani et al. 2019), and turbulence (Harrington et al. 2021). The picture is complicated by the limited amount of information for statistically significant samples that encompass both AGN hosts and control star-forming galaxies matched in stellar mass, SFR, and other relevant properties. Systematic studies of gas excitation conditions could thus help to shed light on the coevolution of AGN and their hosts.
Here we attempt to characterize the AGN activity in the population of main-sequence galaxies and strong starbursts at z ∼ 1 − 1.7 that we surveyed in several CO and [C I] transitions with the Atacama Large Millimeter Array (ALMA; Puglisi et al. 2019, 2021a; Valentino et al. 2020a – V20a from hereafter). Our goal is to gauge the effect of accreting SMBHs on the global SFR, the mass, and the excitation conditions of the cold gas and dust in a large sample of homogeneously IR-selected galaxies. This results in a focus on the AGN activity spread in normal galaxies that are representative of the bulk of the star-forming population (Rodighiero et al. 2011), rather than on the extreme SMGs and QSOs investigated in depth in previous works. For this purpose, we take advantage of a simple and well-understood selection function, the large sample of a few tens of galaxies observed under the same conditions, the wealth of ancillary data, and the rich spectroscopic follow-up comprising multiple CO transitions to evaluate the molecular gas conditions via line luminosity ratios and average full SLEDs. In addition, we have access to well-sampled far-IR dust spectral energy distributions (SEDs) and neutral atomic carbon lines ([C I]), two alternative proxies of the cold ISM that we use to complement and cross-validate the results from the classical CO proxy (Magdis et al. 2012; Scoville et al. 2016; Papadopoulos et al. 2004; Walter et al. 2011). As a matter of fact, this work cannot directly address the spatial scale problem mentioned above due to the limited spatial resolution of the ALMA observations. However, we aim to overcome the lack of systematic observations of direct molecular gas tracers in average star-forming galaxies close to the peak of the cosmic SFR history that are normally not present in the literature, rather than specifically targeting bright QSOs that have been well covered across redshifts in the past. The number statistics of our sample are also the base to determine average trends and, critically, their dispersion.
We briefly recall the specifications of our ALMA survey in the coming sections, but we refer the reader interested in the details of the observations to V20a for a complete description. Here we focus on basic correlations among observables or directly derived quantities and comment on their physical meaning in the various sections and in the final discussion. The master catalog containing all the measurements necessary to reproduce this analysis is publicly available (V20a). For the sake of reproducibility of the results in this work, we report all the data used here, including updates, in a dedicated table available at the CDS. The data products are described in Table A.1. Unless stated otherwise, we assume a Lambda cold dark matter cosmology with Ωm = 0.3, ΩΛ = 0.7, and H0 = 70 km s−1 Mpc−1 and a Chabrier initial mass function (IMF; Chabrier 2003). All the literature data have been homogenized with our conventions when necessary.
2. Data
2.1. ALMA observations and far-IR modeling
We extensively presented our sample and ALMA survey1 in V20a and we refer the reader to that work for further details. Briefly, we selected IR-detected galaxies in the COSMOS field (Scoville et al. 2007) on and above the main sequence for a series of subsequent follow-up observations of several CO (J = 2, 4, 5, 7) and [C I] lines ([C I](3P1 − 3P0), [C I](3P2 − 3P1)) with ALMA. We imposed a detection in Herschel/PACS 100 or 160 μm from the PACS Evolutionary Probe survey (PEP; Lutz et al. 2011). This requirement privileged the selection of massive (median M⋆ = 1010.7 M⊙) upper main-sequence sources (LIR > 5 × 10¹¹ L⊙) and warm dust temperatures at a median redshift of z ∼ 1.2. Here we focus on the sample of 55 galaxies with a robust spectroscopic redshift from submillimeter lines (at least one line with Flag = 1 in V20a) and an estimate of the IR luminosity from the modeling of the SED. We note here that the ALMA observations were carried out at a spatial resolution of 0.8 − 1.4″ (Table 1 in V20a), which was sufficient to estimate global galaxy properties and derive reliable FIR sizes at high S/Ns (Puglisi et al. 2021a), but not to highly resolve the central regions of the galaxies.
The modeling of the SED was performed on the de-blended far-IR catalog by Jin et al. (2018) and our ALMA continuum emission estimates at rest-frame ∼370, 520, 610 μm, and 1.3 mm when available (Fig. 1). We excluded sources without an entry in the far-IR catalog (see V20a). We used the customized χ2 minimization tool STARDUST (Kokorev et al. 2021)2 that includes representative templates spanning the expanded library of Draine & Li (2007) and AGN models from Mullaney et al. (2011). The algorithm returns the total IR luminosity integrated between 8 and 1000 μm (LIR) split into a star-forming (LIR, SFR, associated with the Draine & Li 2007 templates) and an AGN (LIR, AGN) components (LIR = LIR, SFR + LIR, AGN). We define the AGN contribution to the total IR budget as the fraction fAGN = LIR, AGN/LIR.
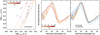 |
Fig. 1. Star-formation and AGN contributions to the total IR luminosities LIR(8 − 1000 μm). Left: our sample of galaxies at z ∼ 1.2, indicated by filled circles and color coded according to the AGN contribution to LIR (fAGN = LIR, AGN/LIR). Blue circles show hard X-ray emitters with L2 − 10 keV > 1043 erg s−1 detected by Chandra. The orange filled star marks the object from Brusa et al. (2018), which is part of our parent sample. The colored lines show the limits for fAGN as labeled. Center, right: rest-frame far-IR SEDs normalized to LIR(8 − 1000 μm) = 1 L⊙ and color coded according to fAGN (central panel) and X-ray detection (right panel). Gray diamonds and arrows show detections and 3σ upper limits on the photometry, respectively. We note that the emission at radio wavelengths is not included in the modeling. |
We caution the reader against low fAGN at face value. Fractions < 1% simply indicate the absence of a significant AGN contribution at long wavelengths, given the available data, and we adopted this threshold as a strict floor for our analysis. Values on the order of ∼5 − 10% partially overlap with hard X-ray detections and they are, thus, more reliable for an AGN classification in the relative scale set by our modeling (Figs. 2 and B.1, Sect. 3.1). We note that setting a more conservative minimum threshold of fAGN > 10% does not affect the main conclusions of this work. We retained the best-fit values for fAGN and their uncertainties in order to allow for a continuous variation in the AGN contribution to the IR energy output of their host, but we stress that the exact values – especially at low fAGN – sensitively depends on the choice of the AGN templates, assumptions in the fitting procedures, and photometric quality and coverage, and should be thus taken with a grain of salt (e.g., Ciesla et al. 2015). For reference, the fAGN from our decomposition are consistent with the reanalysis of the full UV-to-radio SED modeling of part of our sample with MICHI2 (see Liu et al. 2021; Kokorev et al. 2021 for the performances of the two codes and a broader comparison of the derived properties with alternative modeling schemes, e.g., CIGALE, Noll et al. 2009).
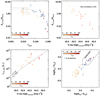 |
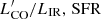
Fig. 2. How observed colors, the full far-IR SED modeling, and X-ray detections compare as tracers of the AGN activity. Top: observed S1.2 mm/S24 μm color (Rayleigh-Jeans/mid-IR rest-frame color) as a function of fAGN and the X-ray luminosity L2 − 10 keV. Bottom left: AGN IR luminosity from SED modeling as a function of L2 − 10 keV. The black line indicates the locus of constant bolometric luminosities derived from X-ray and IR luminosities adopting the corrections as labeled. Bottom right: Spitzer/IRAC S8 μm/S4.5 μm, S5.8 μm/S3.6 μm selection as in Donley et al. (2012). The symbols indicate our sample of z ∼ 1.2 galaxies color coded by fAGN as in previous figures. Open blue circles mark hard X-ray emitters with L2 − 10 keV > 1043 erg s−1. In the top panels, arrows indicate 3σ upper limits on the ALMA continuum emission at 1.2 mm. |
Conversely, large fAGN values of ≳80% mostly occur for galaxies with upper limits at observed wavelengths longer than 24 or 100 μm. In these cases, the standard modeling with all parameters left free to vary initially hit the boundary of the coldest template allowed. Therefore, in order to put physically meaningful limits on LIR, SFR and derive the final fAGN shown in Fig. 1, we refit the SEDs with Draine & Li (2007) templates with a fixed intensity of the radiation field heating the dust (⟨U⟩). This is a unit-less quantity that can be expressed as ⟨U⟩≈1/125 × LIR, SFR/Mdust, where the constant indicates the power absorbed per unit dust mass Mdust in a radiation field with ⟨U⟩ = 1 (Draine & Li 2007; Magdis et al. 2012). In the 4/55 cases with extreme fAGN (Fig. 1), we thus fixed ⟨U⟩ to the average value for galaxies at the same redshift and we allowed for a 30% variation, comparable with the observed scatter of the z − ⟨U⟩ relation (⟨U⟩ = 15 ± 5, Magdis et al. 2017). We note that the starburst-like ⟨U⟩ values allowed by the current constraints would decrease LIR, SFR. This procedure mostly returns LIR, SFR consistent with SFR of main-sequence galaxies.
The code also outputs the dust mass Mdust, directly proportional to the luminosity in the Rayleigh-Jeans tail of the SED, and the aforementioned ⟨U⟩, which can be regarded as a proxy for the dust temperature. We note that ⟨U⟩ is associated with the Draine & Li (2007) templates and it accounts for the heating from the star-forming component only. When necessary, we recomputed a posteriori the total ⟨U⟩ including the AGN component by substituting LIR, SFR with LIR in the equation above. The uncertainties on the best-fit parameters are computed as the 16th−84th percentile confidence intervals over 10 000 randomized realizations of the fitting process. We show the compilation of best-fit models and the photometry for the 55 galaxies considered here in Fig. 1, color coded according to fAGN and the X-ray detection. All the best-fit parameters (footnote 1) and plots of individual SEDs are available online3. Finally, we note that one object in our survey parent sample (#51280) has been analyzed in detail by Brusa et al. (2018), who collected deeper observations of the CO (5−4) emission and its underlying continuum. We included their ALMA measurements and stellar mass estimate, but retained our far-IR SED modeling for consistency with the rest of the sample.
2.2. Ancillary data
The X-ray to radio photometry in the COSMOS field complements the submillimeter spectroscopy with ALMA and allows for the derivation of reliable stellar masses (Laigle et al. 2016; Muzzin et al. 2013). We checked for possible X-ray detections in the 2−10 keV band with Chandra (Marchesi et al. 2016; Civano et al. 2016) and fixed a minimum threshold of L2 − 10 keV = 1043 erg s−1 for a significant AGN detection, which we found in 18/55 sources. We do not retrieve any detections below this limit in our sample. Such a threshold corresponds to SFRs 0.5 − 3.6 and 2.3 − 5.9 dex larger than those we estimate from LIR, SFR following Ranalli et al. (2003) and Lehmer et al. (2010), respectively, supporting nuclear activity as the powering source of the X-ray emission. We also note that the distribution of observed L2 − 10 keV in COSMOS at these redshifts peaks above 1044 erg s−1, below which the completeness drastically decreases while the X-ray luminosity function of AGN keeps rising (Aird et al. 2015). For objects with AGN signatures in the X-ray or mid-IR regimes, we remodeled the UV to near-IR photometry from Laigle et al. (2016) as in Circosta et al. (2018), providing for a self-consistent treatment of the AGN emission across the short wavelength spectrum. This improved the stellar mass estimates of a handful of bright AGN hosts, while not introducing any offsets in M⋆ with respect to the standard COSMOS catalogs for the rest of the sample (Fig. B.2).
3. Analysis and results
In this section we present the main findings of this work in terms of observables or directly derived quantities, such as dust emission, gas line luminosities, stellar masses, and SFRs. Their physical interpretation and insertion in the current research landscape will be further discussed in Sect. 4.
3.1. Widespread AGN activity affects the dust far-IR emission of distant galaxies
The far-IR SED modeling reveals the presence of common AGN activity in our sample of z ∼ 1.2 galaxies, as anticipated in V20a. Thirty percent of the parent surveyed sample has fAGN + 1σfAGN ≥ 20%, thus indicating a relevant contribution of the AGN template in the SED modeling, in agreement with previous reports (Mullaney et al. 2012). We find the same proportion also for the subsample considered here, thus arguing against any trivial selection bias in the line detectability. We also retrieve 6/55 objects with fAGN + 1σfAGN > 50%. For reference, we use the 20% threshold to broadly classify galaxies as AGN based on their IR emission, but the following analysis mostly relies on the continuous distribution of fAGN values and its relation to the properties of the galaxy hosts.
We stress once again that the possibility to detect the mid-IR emission from AGN depends on the coverage – here granted by Spitzer/MIPS photometry – and the intrinsic brightness of the dusty tori and dust heated by the AGN compared with the underlying emission powered by young stars. Therefore, given the positive correlation between stellar masses and SFR, the mild skewness of the M⋆ distribution of AGN hosts toward low values is not completely surprising (Fig. B.2): at fixed LIR, AGN, it is easier to detect the emission of an AGN in lower mass galaxies where the contrast with LIR, SFR is higher. In addition, the choice of the templates for the decomposition affects fAGN at face value. While a direct comparison with other works purely based on fAGN should be drawn with caution, we can check our classification against alternative AGN indicators. The information enclosed in fAGN is comparable with the AGN classification based on Spitzer/IRAC colors (Fig. 2). A smooth gradient of fAGN enters the box hosting AGN designed by Donley et al. (2012), but there are X-ray-detected sources outside it. Above fAGN + 1σfAGN > 20%, a criterion based on fAGN largely overlaps with the detection of hard X-ray photons in Chandra’s 2−10 keV band (Fig. 4 in V20a; see also Brown et al. 2019). Here 86% percent of the sample with fAGN + 1σfAGN ≥ 20% has L2 − 10 keV > 1043 erg s−1 (not applying the modest ≲5 − 15% absorption corrections, Marchesi et al. 2016). Conversely, ∼13% of the population below this fAGN threshold is detected by Chandra, gauging the degree of overlap between these two AGN selection criteria in a regime where star-formation dust heating dominates the IR budget. Similar values are found for the whole survey parent sample. We thus consider the X-ray-detected sources as AGN hereafter.
The overlap between the mid-IR and X-ray definition is reflected on the shapes of the overall SEDs (Fig. 1). The presence of an AGN boosts the emission in the mid-IR and only apparently suppresses the luminosity in the Rayleigh-Jeans tail of the SED at fixed LIR due to the normalization. This is shown in Fig. 2 in the form of the observed S1.2 mm/S24 μm color (≈S500 μm/S11 μm rest-frame) probing two critical regimes proportional to the total dust mass content and the AGN energy output, respectively. Given the small redshift range probed by our sample, we used the observed photometry to compute this color, thus being model independent. The observed S1.2 mm/S24 μm color tightly anticorrelates with fAGN and the L2 − 10 keV luminosity (Fig. 2). We note that the total luminosity density at rest-frame 11 μm independently correlates with L2 − 10 keV while it does not at 500 μm, once the effect of the stellar mass is folded in the calculation. This suggests that most of the AGN effect is exerted in the mid-IR as a result of increased dust heating, but without any apparent impact on the Rayleigh-Jeans tail and, thus, on the total dust mass content, as it could be expected in a scenario with an efficient negative feedback onto the host (Sect. 4).
We also note that LIR, AGN correlates well with L2 − 10 keV in our sample (Fig. 2; see Gandhi et al. 2009) and supports the interchangeable usage of fAGN, L2 − 10 keV, and LIR, AGN as tracers of AGN activity in our sample. On the other hand, we do not find any significant correlation between LIR, AGN or L2 − 10 keV and LIR, SFR at fixed stellar and dust masses, proxies for the specific SFR (sSFR) and SFE, respectively. The AGN activity seems not to suppress nor enhance the formation of new stars or its efficiency in the galaxies in our sample. However, we note that LIR, SFR and L2 − 10 keV probe star formation and AGN activities characterized by different timescales (∼100 Myr and < 10 Myr, respectively). This is a known limitation to the comparison between these quantities (e.g., Hickox et al. 2014; Stanley et al. 2015).
3.2. The effect on CO line luminosities
Once we factor out the contribution of AGN-heated dust to the total IR luminosity (LIR, SFR = LIR − LIR, AGN), the central nuclei seem to marginally affect the CO emission. In Fig. 3, we show the CO (2 − 1) and CO (5−4) L′ luminosities as a function of LIR, SFR. The line luminosities are defined as:
![Mathematical equation: $$ \begin{aligned} L^\prime _{\rm line}\,[\mathrm{K\,km\,s^{-1}\,pc^2}] = 3.25\times 10^7\,S_{\rm line}\,\Delta { v}\,\nu _{\rm obs}^{-2}\,(1+z)^{-3}D_{\rm L}^2, \end{aligned} $$](/articles/aa/full_html/2021/10/aa41417-21/aa41417-21-eq2.gif) (1)
(1)
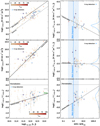 |
Fig. 3. AGN effect on CO line emission. Left column, from top to bottom: CO (2 − 1), CO (5−4) luminosities and their ratio as a function of the IR luminosities from the star-forming component LIR, SFR. Right column: CO (2 − 1)/LIR, SFR, CO (5 − 4)/LIR, SFR, and CO (2 − 1)/CO (5−4) luminosity ratios as a function of the distance from the main sequence as parameterized in Sargent et al. (2014) (blue area and vertical solid line). Filled circles mark our sample at z ∼ 1.2 color coded according to fAGN. Empty blue circles show hard X-ray emitters with L2 − 10 keV > 1043 erg s−1 detected by Chandra. The orange filled star marks the object from Brusa et al. (2018), which is part of our parent sample. Open triangles and squares represent local objects and distant SMGs from Liu et al. (2021) color coded according to fAGN. Filled squares indicate the ASPECS sample, with X-ray AGN marked with blue empty squares (Boogaard et al. 2020). The gray and green dashes mark the R52 for the average SLED of distant QSOs in Carilli & Walter (2013) and Mrk 231 (van der Werf et al. 2010), respectively. Solid black lines show the loci of main-sequence and starburst galaxies in Sargent et al. (2014) (top left panel) or the best-fit relations in V20a, as labeled. The solid blue and yellow lines in the right column show the kernel density estimation (KDE) of the properties on the Y axis for Chandra-detected AGN and star-forming galaxies normalized to their relative frequency and rescaled for visibility. Only detections are included in the KDE. |
where Sline Δv is the velocity-integrated line flux in Jy km s−1, vobs is the observed line frequency in GHz, z is the redshift, and DL is the luminosity distance in Mpc (Solomon & Vanden Bout 2005). For reference, we also show the sources detected by the blind ALMA Spectroscopic Survey in the Hubble Ultra Deep Field (ASPECS) at z ∼ 1.2 and ∼2.5 (Boogaard et al. 2020), whose SEDs we remodeled using our algorithm, notably including Herschel photometry (T. Wang, priv. comm.). Moreover, we also added the literature compilation from Liu et al. (2021) who applied an SED modeling similar to and consistent with ours to nearby galaxies and distant SMGs. For a meaningful comparison, we show objects in the same range of redshift and luminosities of our sample. Including local galaxies with lower luminosities and the handful of powerful (possibly lensed) SMGs at z > 4 in the compilation does not appreciably affect the main points of this work.
Although with a substantial scatter, AGN hosts appear to preferentially occupy an intermediate locus between main-sequence and starbursting galaxies in the  plane, according to the parameterization of Sargent et al. (2014). When a mid-J transition such as CO (5−4) is considered, galaxies hosting an AGN are fully mixed with the rest of the star-forming population, both groups following the relation presented in V20a. This reinforces the idea that CO (5−4) can be used as a tracer of SFR independently of the galaxy type. However, we report the elevated
  luminosity for two sources with the highest fAGN given their LIR, SFR, despite the large uncertainties on the latter. The J = 5/2 luminosity ratio
  naturally reflects these trends and it does not appear substantially affected by the presence of AGN at fixed LIR, SFR. A similar conclusion is reached comparing R52 with LIR, AGN or fAGN (see also Liu et al. 2021). In addition, despite the low number statistics, R52 does not correlate with LIR, AGN/L2 − 10 keV (Fig. 4). This ratio is a proxy for heavy obscuration in AGN approaching or in the Compton-thick regime (e.g., Del Moro et al. 2016) and it allows us to check for the existence of a possible dependence of the CO excitation on the large dust opacities expected in strongly starbursting AGN hosts at high LIR, AGN/L2 − 10 keV ratios (see also Sect. 3.6). We find a probability of no correlation of 30% from a generalized Kendall’s tau test including the upper limits. This is robust against the exclusion of the lowest LIR, AGN/L2 − 10 keV value (pno corr = 25%). For simplicity, in Fig. 4 we show the observed luminosities corrected to the bolometric output by adopting constant 1.5× (Elvis et al. 1994) and 22.5× (Vasudevan & Fabian 2007) factors for LIR, AGN and L2 − 10 keV, respectively. Using different bolometric corrections from the literature (e.g., Lusso et al. 2011) does not alter this conclusion (see Lusso et al. 2012; Duras et al. 2020 and references therein for more refined luminosity-dependent corrections and their substantial uncertainties, which are beyond the scope of this paper).
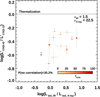 |
Fig. 4. CO line excitation (R52) as a function of a proxy for heavy obscuration (LIR, AGN/L2 − 10 keV). LIR, AGN and L2 − 10 keV have both been corrected to the total bolometric output by factors of 1.5 and 22.5, respectively. The symbols represent our sample at z ∼ 1.2 and are color coded as in the previous figures. |
Finally, we find that the CO (7 − 6) line provides a consistent picture to that of CO (5 − 4), despite being more uncertain due to low number statistics as 20% of our sample has the right frequency coverage (see Lu et al. 2015; Liu et al. 2015, and V20a for a comparison between CO (5 − 4) and CO (7 − 6) as SFR tracers).
3.3. A standard metric: The distance from the main sequence
Marginally lower  luminosities at fixed LIR, SFR could potentially suggest a prevalence of starburst-like high SFEs (SFE = SFR/Mgas) or equivalently shorter depletion timescales (τdepl = SFE−1) in AGN hosts. To test for this, we plot the
  ratio of our sample as a function of the distance from the main sequence (ΔMS = SFR/SFRMS, Fig. 3). AGN hosts occupy the lower end of the distribution of the ratios over the same interval of ΔMS spanned by the star-forming population (Fig. 3). This is also the locus occupied by the compact objects with size measurements from ALMA (Puglisi et al. 2021a). A logrank test shows indeed a mild tendency of AGN to reside in compact galaxies, defined based on their distance from the mass-size relation (Puglisi et al. 2021a; see also Sects. 3.6 and 4). Their reduced CO (2 − 1) luminosities might thus be plausibly driven by the size of the host and the ensuing larger SFR densities, rather than the presence of the AGN. In addition, a non-parametric Kolmogorov-Smirnov test returns a probability of 9.4% that the
  distributions for Chandra-detected AGN and star-forming galaxies are drawn from the same parent population, confirming that the effect is not statistically significant at this stage. We note that we considered only CO (2 − 1) detected objects for the calculation. Moreover, with the notable exception of the two objects with elevated
  luminosity mentioned in the previous section, we do not find any significant difference in the distribution of the CO (5 − 4)/LIR, SFR or CO (5 − 4)/CO (2 − 1) ratios as a function of ΔMS.
3.4. Average CO spectral line energy distributions
We further attempted to assess the average SLEDs of AGN hosts and star-forming galaxies (Fig. 5). Here we split the sample both at fAGN = 20% (including the upper limits) and according to the hard X-ray detection as detailed in Sect. 2. As seen above, these alternative AGN classifications generally overlap and provide consistent results so far. However, they do so by cutting the sample in slightly different ways, capturing different intermediate sources, and complementing each other when the number statistics according to one criterion are not sufficient to compute meaningful ratios. We computed the mean SLEDs using the Kaplan-Meier estimator (Kaplan & Meier 1958) and we included robust upper limits (Flag = 0.5 in V20a). The mean and median L′ luminosities are reported in Table B.1. The line ratios in Fig. 5 are expressed as fluxes at the median redshift of the surveyed sample (z = 1.25) after averaging the luminosities to take out the distance effect. The average SLEDs are computed over the sources meeting the requirements for the selection for the CO (2 − 1) follow-up in our survey, not to bias the line ratios (V20a). The SLEDs are normalized by the value for the average main-sequence galaxies to ease the comparison with our previous work also reported in Fig. 5. As in V20a, we accounted for the possible bias introduced by the spectral sampling of the CO (2 − 1) ALMA follow-up. This results in similar total LIR distributions for the objects entering the average of each line, thus not requiring any further normalization that could bias the average values (Kirkpatrick et al. 2019).
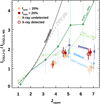 |
Fig. 5. Average CO spectral line distributions of AGN hosts and star-forming galaxies as well as average SLEDs for AGN hosts and star-forming galaxies normalized to the average CO (2 − 1) flux of main-sequence galaxies at z ∼ 1.2 from V20a. Filled yellow and red circles indicate galaxies in our sample with fAGN ≤ 20% and > 20%, respectively. Open yellow and red circles show objects split according to their Chandra detection at 2−10 keV. Blue open squares represent the SLEDs of the main sequence and (extreme) starbursts (> 7×) > 3.5× above the main sequence from V20a. Filled light and empty dark green stars show the average SLEDs from the stacking in Kirkpatrick et al. (2019), splitting AGN hosts and star-forming at fAGN, mid-IR = 50% (comparable with our fAGN = 20% threshold; see their Eq. (1)). The dashed gray line marks the QSO SLED in Carilli & Walter (2013). The L′ luminosity values for our samples are reported in Table B.1. We note that the statistics of X-ray detections of AGN with measurements of CO (4 − 3) are not sufficient to derive an average estimate. |
At face value, we find only a higher CO (7 − 6) emission for AGN hosts than in the star-forming population. Nevertheless, the Chandra detected and the fAGN > 20% samples include 100% and 25% of the extreme starbursts (ΔMS > 7) identified in V20a. Therefore, it does not entirely come as a surprise that the CO (7 − 6) emission resembles the one of strongly starbursting galaxies previously identified. Further splitting our sample according to the distance from the main sequence and the AGN contribution could help to understand the dominant mechanism setting the CO (7 − 6) emission, but the current number statistics prevent us from doing so (Table B.1). We do not find any other significant divergence in the average CO SLED between AGN hosts and the star-forming population. This holds also when raising the fAGN threshold to identify AGN to a more extreme 50%. On the other hand, we do retrieve a substantial diversity within both subsamples (Fig. B.3) and the large scatter likely plays a major role in comparing single objects with statistical and – to some extent inhomogeneous – samples. For reference, we also show the stacking results for the mid-IR-selected galaxies with Spitzer/IRS spectra from Kirkpatrick et al. (2019) and the classical QSO sample in Carilli & Walter (2013). These SLEDs appear more excited than the ones presented here, likely due to their coverage of more extreme objects with intrinsically larger total LIR and more powerful AGN over a wide range of redshifts (see also Weiss et al. 2007; Banerji et al. 2018; Bischetti et al. 2021 for other examples of highly excited SLEDs of hyper-luminous QSOs at z ∼ 2 − 3). We stress that the primary goal of the initial survey that provided the parent sample for this study was to target relatively faint IR-selected galaxies on the main sequence, normally underrepresented in previous studies. Discounted this difference in normalization, our conclusions are similar to Kirkpatrick et al. (2019), who found only marginal evidence for enhanced CO ratios in galaxies with large fAGN, but without statistical significance. We note that these authors classify their sample according to an analogous, but not identical definition of mid-IR fAGN, mid-IR (5 − 15 μm) computed from spectral fitting or color diagrams (for reference, fAGN, mid-IR = 50% corresponds to fAGN(8 − 1000 μm) = 14.75%, Eq. (1) in Kirkpatrick et al. (2019), comparable with our fiducial threshold). Targeted observations with optically selected and radio-loud AGN (Sharon et al. 2016) and blind CO searches coupled with an X-ray AGN classification (Boogaard et al. 2020) also return analogous conclusions. This pairs up with the results on R52 in Sect. 3.2 and similar findings in Liu et al. (2021). We return to these points in Sect. 4.
3.5. An alternative view from neutral atomic carbon [CI] line luminosities
Here we have the possibility to compare the results based on CO (2 − 1) in the previous sections with an alternative molecular gas tracer, the neutral atomic carbon [C I] (Papadopoulos et al. 2004; Bisbas et al. 2015; Madden et al. 2020). Figure 6 shows the luminosities of both [C I](3P1 − 3P0) and [C I](3P2 − 3P1) transitions and their ratio as a function of LIR, SFR. We complement our measurements with main-sequence and starburst galaxies at z ∼ 1.2 from Valentino et al. (2018), which were selected and modeled similarly to the sample presented here. The statistics of objects with large fAGN is scarce, thus we focus on the X-ray classification. Based on Fig. 6, the AGN do not appear to have strong effects on the [C I] emission. The current paucity of normal galaxies with both lines available does not allow us to derive a firm conclusion on the excitation temperature as traced by the [C I](3P2 − 3P1)/[C I](3P1 − 3P0) luminosity ratio (Weiß et al. 2005). However, we note that the observed [C I] ratios for both AGN hosts and star forming galaxies (SFGs) is consistent with the average value and its large scatter for the data compilation in Valentino et al. (2020b). These results confirm what we anticipated in previous works (Valentino et al. 2018, 2020b; see also Jiao et al. 2017) showing roughly constant ![Mathematical equation: $ L^{\prime}_{\mathrm{[C\,\scriptscriptstyle{I}]}^3\mathrm{P}_1\,{-}\,^3\mathrm{P}_0} $](/articles/aa/full_html/2021/10/aa41417-21/aa41417-21-eq10.gif) /
/ ,
, ![Mathematical equation: $ L^{\prime}_{\mathrm{[C\,\scriptscriptstyle{I}]}^3\mathrm{P}_2\,{-}\,^3\mathrm{P}_1} $](/articles/aa/full_html/2021/10/aa41417-21/aa41417-21-eq12.gif) /
/![Mathematical equation: $ L^{\prime}_{\mathrm{[C\,\scriptscriptstyle{I}]}^3\mathrm{P}_1\,{-}\,^3\mathrm{P}_0} $](/articles/aa/full_html/2021/10/aa41417-21/aa41417-21-eq13.gif) , and [C I]/dust mass ratios across not only the IR-selected samples presented here, but also local luminous IR galaxies, distant SMGs, and QSOs, once the effect of the AGN on the dust continuum emission is accounted for. If any, only a mild correlation between the
, and [C I]/dust mass ratios across not only the IR-selected samples presented here, but also local luminous IR galaxies, distant SMGs, and QSOs, once the effect of the AGN on the dust continuum emission is accounted for. If any, only a mild correlation between the ![Mathematical equation: $ L^{\prime}_{\mathrm{[C\,\scriptscriptstyle{I}]}^3\mathrm{P}_2\,{-}\,^3\mathrm{P}_1} $](/articles/aa/full_html/2021/10/aa41417-21/aa41417-21-eq14.gif) /
/![Mathematical equation: $ L^{\prime}_{\mathrm{[C\,\scriptscriptstyle{I}]}^3\mathrm{P}_1\,{-}\,^3\mathrm{P}_0} $](/articles/aa/full_html/2021/10/aa41417-21/aa41417-21-eq15.gif) ratio and the dust temperature is present (Jiao et al. 2019; Valentino et al. 2020b). This supports the conclusions drawn from the analysis of the low and mid-J CO emission.
ratio and the dust temperature is present (Jiao et al. 2019; Valentino et al. 2020b). This supports the conclusions drawn from the analysis of the low and mid-J CO emission.
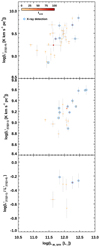 |
Fig. 6. AGN effect on [C I] emission: [C I](3P1 − 3P0) and [C I](3P2 − 3P1) L′ luminosities and their ratio as a function of the IR luminosities from the star-forming component LIR, SFR. Filled and empty blue circles mark our sample at z ∼ 1.2 as in previous figures. Squares indicate the sample in Valentino et al. (2018), selected at similar redshift and luminosity. |
3.6. A point about dust masses, opacities, and sizes
Continuum dust emission at long wavelengths is known to trace the cold gas in star-forming galaxies (Magdis et al. 2012; Scoville et al. 2016). In this section, we use it as a third independent method to gauge the effect of AGN on the gas reservoirs in the sample. The full SED modeling does not show any significant discrepancy between the Mdust distributions of star-forming galaxies and AGN hosts for similar stellar masses. The dust mass fraction Mdust/M⋆ does not vary as a function of L2 − 10 keV or LIR, AGN (Fig. 7): galaxies with an active nucleus appear to have the same amount of dust as star-forming galaxies of the same stellar mass and location with respect to the main sequence. On the other hand, we retrieve the increasing dust and gas fraction as a function of the distance from the main sequence (e.g., Magdis et al. 2012; Tacconi et al. 2018; Elbaz et al. 2018). This mirrors the result based on the single-band rest-frame 500 μm luminosity density (Sect. 3.1).
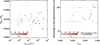 |
Fig. 7. Effect of AGN on the dust fraction and opacity. Left: dust fraction Mdust/M⋆ as a function of LIR, AGN. Right: wavelength at which the dust optical depth reaches unity as a function of fAGN. Symbols and colors mark our sample at z ∼ 1.2 as in previous figures. |
We note here that the Draine & Li (2007) far-IR templates used for the SED fitting assume that the continuum emission is optically thin at long wavelengths, which is also the premise to use dust as a cold gas tracer, while the AGN templates are purely empirical and could include self-absorption (Mullaney et al. 2011). Systematically larger dust optical thickness for AGN hosts could thus conceal truly lower dust masses and higher temperatures. This is known to be a factor for the most extreme dusty objects across cosmic time (Blain et al. 2003; Spilker et al. 2016; Scoville et al. 2017; Simpson et al. 2017; Jin et al. 2019; Cortzen et al. 2020, and many others). We tested this possibility by computing a posteriori the wavelength at which the dust optical depth τdust reaches unity. We calculated τdust = κ(ν) Σd = κ850 μm (ν/ν850 μm)β Mdust/(2πR2), where κ is the frequency-dependent dust opacity, and Σd the dust mass surface density (e.g., Casey et al. 2014). We used κ850 μm = 0.43 cm−2 g−1 and β = 2 (Li & Draine 2001), Mdust from the full SED modeling (Sect. 2), and the sizes or upper limits from the ALMA measurements when available (R = FWHM/2 from the Gaussian source extraction, V20a). The use of the far-IR sizes breaks the apparent tautology when using Mdust from the SED modeling. The same calculation with Mdust derived from an ideal SED modeling with the opacity as a free parameter would be lower, further decreasing the value of τdust. In Fig. 7, we show the relation between the wavelength λ0 at which τdust = 1 and fAGN. Here we limited the analysis to galaxies with at least one detection of the continuum emission with ALMA to avoid severe blending issues and poor constraints on the Rayleigh-Jeans luminosities, while lower limits on λ0 (due to upper limits on the size) are included. In this extreme case, we find a correlation between fAGN and λ0 (probability of no correlation of 0.5% from a generalized Kendall’s tau test including censored data on both axes). On average, ⟨λ0⟩ is 1.8× longer for X-ray detected objects than the star-forming population (⟨λ0⟩X-ray = 51 ± 8 μm and ⟨λ0⟩SFG = 27 ± 3 μm, difference significant at 2.8σ, Fig. 7). However, we note that only in a handful of cases λ0 reaches values close to 100 μm, the limit above which we assumed optical thinness in our SED modeling. This argues against a strong bias in the determination of Mdust. A similar conclusion is reached when comparing the distributions of ⟨U⟩≈1/125 × LIR/Mdust where we accounted for LIR, AGN. We do retrieve higher ⟨U⟩ in X-ray detected sources than star-forming galaxies, but not significantly (⟨U⟩X-ray = 33.7 ± 4.4 and ⟨U⟩SFG = 26.1 ± 3.6, respectively). In addition, the full distributions of ⟨U⟩ and λ0 for AGN hosts and star-forming galaxies are consistent with being drawn from the same parent distribution according to a Kolmogorov-Smirnov test (p⟨U⟩ = 0.12 and pλ0 = 0.06). This is further reinforced when removing the constraint on the ALMA continuum detections.
The fAGN − λ0 relation is likely driven by a marginal anticorrelation between fAGN and the host’s size at fixed M⋆ (Fig. 8). A Kendall’s tau test including upper limits returns a probability of no correlation between fAGN and the distance from the mass-size relation for late type galaxies at these redshifts (van der Wel et al. 2014) of ∼1%, suggesting that the compact galaxies in our sample tend to show enhanced nuclear activity (Sect. 3.3; Puglisi et al. 2019, 2021a). Nevertheless, this result is affected by the choice of the mass-size relation necessary to anchor the calculation, removing the effect of the stellar masses, and the uncertainties to which it is prone. Using the compactness criterion based on the reanalysis of far-IR and optical sizes from Puglisi et al. (2021a), the correlation is weaker (∼8% probability of no correlation with fAGN). The large intrinsic scatter of the relations in place and the number statistics do not allow any stronger conclusions to be derived at the moment.
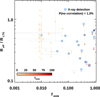 |
Fig. 8. Compactness of AGN hosts. Distance from the optical mass-size relation for late-type galaxies expressed as Reff/RLTG as parameterized in van der Wel et al. (2014) as a function of fAGN. The symbols represent our sample at z ∼ 1.2 color coded according to fAGN as in the previous figures. |
Overall, we retrieve at best marginal differences in dust sizes, intensity of the interstellar radiation field, and far-IR optical depth between galaxies hosting X-ray or mid-IR detected AGN and the star-forming population. We do not find any significant differences in dust (and thus gas) fractions.
4. Discussion
4.1. Marginal effects of AGN on the average properties of their hosts
The analysis of our sample of main-sequence and starburst galaxies at z ∼ 1.2 highlights how AGN activity is distributed among star-forming galaxies and securely detectable at IR wavelengths. A few recent literature works push the AGN contribution to the luminosity output of the brightest QSOs and SMGs to the submillimeter regime (Symeonidis et al. 2016; Symeonidis 2017; Shanks et al. 2021). However, the debate on the effective emission at the longest wavelengths is still ongoing (see Bernhard et al. 2021 for a recent assessment and detailed comparison of several AGN templates available in the literature). Overall, if not properly taken into account, the IR emission connected with nuclei activity can cause an overestimation of the SFRs in dusty galaxies. We reiterate that the initial selection criterion based on a detection at 100 or 160 μm biases the sample toward warmer dust temperatures and, thus, potentially larger fraction of AGN hosts among our targets. However, we do retrieve a fraction of active galaxies in our sample similar to previous works (e.g., Mullaney et al. 2012). Despite such activity, for the most part AGN hosts share similar properties with the rest of our star-forming sample. On average, we do not retrieve any significant departure in terms of various CO and [C I] line luminosities or their ratios, excitation conditions and SLEDs up to J = 7, dust and gas masses, fractions, or SFR.
In terms of CO line luminosities and excitation, our results are consistent with the recent reanalysis of the literature reported in Kirkpatrick et al. (2019). We note that these authors adopted a mixed approach based on the spectral fitting of Spitzer/IRS data and a combination of IR colors to quantify the AGN emission (Kirkpatrick et al. 2017). In broad terms, this approach is similar to ours (especially considering the consistent results that we obtain when adopting fAGN from the full SED modeling and simpler color cuts, Fig. 1), but not identical. A second notable difference is the homogeneous selection used here, rather than a combination of literature data, and the systematic coverage of more normal main-sequence objects typically underrepresented in past work due to their lower luminosities. Similar findings on the CO SLEDs are reported for relatively large collections of galaxies at z ∼ 1 − 3, either consistently selected and observed (Sharon et al. 2016; Boogaard et al. 2020) or compiled from the literature (Liu et al. 2021). Despite suffering from low number statistics, the [C I] line ratio – a proxy for the gas temperature –, also suggests no major impact of AGN on the cold gas, as previously reported based on a larger literature compilation (Valentino et al. 2020b).
Nevertheless, highly excited SLEDs have been frequently reported for the most luminous, frequently lensed, and unobscured QSOs (e.g., Weiss et al. 2007; Carilli & Walter 2013; Banerji et al. 2018; Fogasy et al. 2020; Bischetti et al. 2021) and often associated with depleted gas reservoirs in the host. The difference with our findings are the likely result of a combination of factors. Primarily, the selection function: here we inherited the AGN properties for a sample of IR-selected star-forming galaxies, rather than focusing on previously identified QSOs at the peak of their power or in presence of documented massive outflows, just to mention two popular criteria. This resulted in lower AGN luminosities spread among the typical population of star-forming objects (log(Lbol/erg s−1)∼45 against, for example, log(Lbol/erg s−1) > 47.5 in Bischetti et al. 2021). The presence of highly excited CO gas is then frequently associated with copious X-ray photons from the AGN (Meijerink et al. 2007; Vallini et al. 2019) or shocks induced by the outflowing gas. However, considering that most of the information on the CO excitation currently available in our sample comes from a mid- to low-J transition ratio such as R52, it is hard to draw an unambiguous conclusion as most of the effect of these mechanisms is expected to occur at high J. As a reference, a case study for the effect of X-rays on the CO SLED as Mrk 231, also hosting abundant multiphase outflows (Cicone et al. 2012), has an estimated 10% contribution to the CO (5−4) luminosity from the X-ray Dominated Regions (XDRs) component and a virtually null impact on CO (2 − 1) (van der Werf et al. 2010). The XDRs dominate over UV-photon-dominated regions at high J (J > 9 − 10), a regime still rarely covered at high redshift (but see Gallerani et al. 2014; Carniani et al. 2019; Fogasy et al. 2020) and not accessible with our data. In addition, X-rays, cosmic rays, turbulence, shocks, and mechanical heating in general can be induced by common processes not related to AGN such as stellar winds, supernovae explosions, mergers, or gas accretion (Meijerink et al. 2013; Lu et al. 2014, 2017; Rosenberg et al. 2015; Kamenetzky et al. 2016; Harrington et al. 2021, and many others). Considering the increasing SFR and merger rates with redshift, it is not unreasonable to consider these mechanisms as contributors to the CO excitation in distant AGN hosts. Adding the information on [C I] could in principle offer another way to constrain the effect of X-rays from AGN, as elevated [C I]/CO ratios due to CO dissociation have been reported at the center of nearby AGN hosts (Israel & Baas 2002; Israel et al. 2015; Izumi et al. 2020). However, this would require observations able to resolve the central regions of galaxies, where the strongest effect is expected, and the simultaneous modeling of cosmic rays, also able to volumetrically break the CO molecules and predicted to be abundant in centrally concentrated starbursts (Papadopoulos et al. 2004, 2018).
Lower fgas and shorter depletion timescales in AGN hosts than in star-formation-dominated objects have also been recently reported for samples of various sizes specifically selecting bright AGN (Perna et al. 2018; Brusa et al. 2018; Kakkad et al. 2017; Bischetti et al. 2021), at odds with ours and similar findings in terms of SFR and gas masses (e.g., Stanley et al. 2017; Schulze et al. 2019; Kirkpatrick et al. 2019). In particular, Circosta et al. (2021) reported a marginally significant difference between the CO (3 − 2) emission of matched samples of purely star-forming galaxies and AGN at z ∼ 2. Interestingly, they covered a range of AGN luminosities partially overlapping with that of this work (44.5 < log(Lbol/erg s−1) < 47), rather than focusing only on bright QSOs, and chose to focus on observables without introducing any dependence on excitation corrections or gas mass conversion factors. Therefore, it might not come as a surprise that their results are somehow in between our findings and literature works. In our case, the result on Mgas, fgas, and SFE holds using three different cold gas tracers, namely CO (2 − 1), [C I](3P1 − 3P0), and dust, thus excluding strong systematics linked to the use of a particular proxy. Again, the different selection criteria might play a significant role in the interpretation of this outcome, as well as the ascertained presence of massive outflows that can plausibly be responsible for substantial gas expulsion. We do not find any strong signatures of molecular outflows in our sample at the current sensitivity, excluding a couple of notable cases (the object presented in Brusa et al. 2018 or ID #2299, not associated with the central nuclear activity, Puglisi et al. 2021b). This might be because we are probing quieter phases of AGN activity more spread among the bulk of the star-forming population, rather than the pinnacle reached in bright QSOs. However, deeper and more systematic observations will be necessary to constrain the faint broad wings that we might expect to detect in our sample. A mass effect can also be in place, as most of the AGN with high fAGN in our sample are hosted in lower mass galaxies (M⋆ ∼ 1010 M⊙, Fig. B.2), a regime where no major effects of the AGN presence are generally observed (Circosta et al. 2021).
From a theoretical perspective, recent high-resolution and idealized simulations support these findings, with only the most luminous QSOs (Lbol ∼ 1047 erg s−1) being able to affect the gas reservoirs of their host. Inefficient coupling with the ISM, lower luminosities, higher gas fractions, and outflow geometries can explain the lack of impactful AGN feedback in distant gas rich galaxies (e.g., Gabor & Bournaud 2014; Roos et al. 2015; Torrey et al. 2020). However, the range of findings from simulations is wide and the debate is still ongoing (Biernacki & Teyssier 2018; Barnes et al. 2020; Costa et al. 2020). Also, the cumulative effect of recurrent AGN feedback, rather than individual bursts on short timescales probed by the proxies that we adopted here, has been proposed as a factor affecting galaxy evolution, even if hard to constrain empirically (Harrison 2017). Using not only the existence of multiphase and high-velocity outflows as benchmark for simulations, but also the physical properties of the cold ISM will ease the comparison with data in the immediate future.
We also reported a mild tendency of AGN host to have compact submillimeter sizes, which could explain the larger dust optical depths compared with the galaxies dominated by star formation. Reversing the argument, we previously reported the presence of AGN signatures in ∼40% of the compact galaxies in our sample, classified accordingly to their distance from the mass-size relation (Puglisi et al. 2019, 2021a). It is not unusual to find even powerful AGN and QSOs embedded in small galaxies (e.g., Talia et al. 2018; Elbaz et al. 2018; Brusa et al. 2018; D’Amato et al. 2020; Bischetti et al. 2021). This could be interpreted as a signature of the existence of a common mechanism triggering both the accretion of gas onto the central SMBH, its activity, and the bursts of star formation observed in the compact host, driving their coevolution. Compact hosts might also be the preferential location where to look for the most efficient configurations to launch massive outflows (e.g., Costa et al. 2020). Violent gas disk instabilities, minor or major mergers, or simple gravitational destabilization are able to funnel gas toward the central regions of galaxies, igniting the AGN and star formation activity (V20a and references therein). We note that the ensuing high SFR surface densities in compact starbursting galaxies hosting an active nucleus might be sufficient to explain the shape of the observed SLEDs at least up to mid-J transitions (V20a), as also advocated in models and simulations (Narayanan & Krumholz 2014), without resorting to AGN-driven effects. This could not explain highly excited SLEDs of QSOs found in very extended disks (Bischetti et al. 2021) for which the long reach of AGN heated photons might be a more suitable explanation. Finally, we mention again that our observations are not able to resolve the central regions of the galaxies down to the 100−500 pc scales where most of the effect of AGN is generally expected and observed in the local Universe (Vallini et al. 2019, and references therein). This might also contribute to explain why more compact galaxies seem to have more excited gas reservoirs, as a larger fraction of molecular gas is in the vicinity (less than a few hundred pcs) of the active nucleus. Future high spatial resolution measurements will be able to disentangle the contribution of star formation and AGN on the gas excitation.
4.2. Nuclear activity as a factor contributing to the wide variety of excitation conditions in normal galaxies
If the average properties of AGN hosts and star-forming galaxies appear consistent with each other, the observed dispersion of CO luminosities and line ratios even for a homogeneous sample like ours still suggests an underlying complex picture (V20a). We already mentioned that two of the sources with the highest fAGN are over-luminous in CO (5−4) given their LIR, SFR (Fig. 3) and that more powerful QSOs are associated with highly excited CO SLEDs. This encouraged us to investigate the possible role of AGN as a second factor regulating the CO emission at mid to high J, contributing to the scatter of the observed  relations and explaining the outliers hosting strong AGN. Given the large statistics available, we thus attempted to model
  as a linear combination of LIR, SFR and LIR, AGN. We included all the local and z ∼ 1 − 3 points from our sample and the compilations in Boogaard et al. (2020) and Liu et al. (2021). We considered the uncertainty on every variable and modeled the upper limits on
  adopting the Bayesian multiple linear regression code MLINMIX_ERR.PRO by Kelly (2007), which we modified in a minor way to impose a zero constant α intercept4. To account for the uncertain LIR, AGN at fAGN < 1%, we adopted the best-fit values from the SED modeling and boosted their uncertainties to ensure a minimal coverage of the fAGN = 0 − 1% range. The best-fit model is:
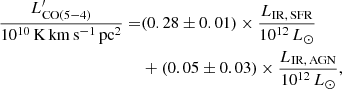 (2)
(2)
where the parameters are the median and the range enclosing the 16−84% of the posterior probability distribution. Such a distribution is symmetrical and adopting the mean and standard deviation returns consistent results. We also estimate an intrinsic scatter of 0.16 dex. We visualize this hyperplane in the 2D projections  and
and  in Fig. 9. As known, LIR, SFR empirically correlates with
  and this is reflected also in the
  plane where most of the gradient is due to smoothly increasing LIR, SFR with LIR, AGN. This is confirmed by the partial correlations coefficients from the fit (p(
 , LIR, SFR ∣ LIR, AGN) = 0.91 and
  ). Similar best-fit parameters are retrieved when imposing a cut on the strength of the AGN defined as X-ray detected or with fAGN + 1σfAGN > 20%. This naturally boosts the partial correlation between LIR, AGN and
  . We note that we adopted LIR, SFR and LIR, AGN as parameters to adhere as close as possible to observations, but the model could be expanded to more physical quantities as SFRs or include further corrections as bolometric factors.
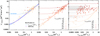 |
Fig. 9. LIR, SFR, LIR, AGN, and |


This simple model returns the already established  relation and its slope for LIR, AGN → 0, when evaluated under the same assumptions of linearity and null intercept and over the same sample. It is also consistent with past determinations following a similar recipe (Daddi et al. 2015). Moreover, it decreases the intrinsic scatter of the standard
  relation by 17%, while explaining the presence of the outliers as due to over-luminous AGN at fixed LIR, SFR. This suggests that the strength of an AGN and its contrast with the underlying star formation activity can act as a secondary factor contributing to the emission of a mid-J CO emission as J = 5, for example via XDR, and might be responsible for strong outliers with large fAGN. In Fig. 10, the boost of
  compared to the level expected from LIR, SFR is shown as a function of the AGN/SF contrast expressed in terms of LIR, AGN/LIR, SFR, along with the corresponding projections of the plane in Eq. (2). We note that, by modeling the data directly in the LIR, AGN/LIR, SFR –
  /LIR, SFR space, we find a 1.4× higher normalization for AGN hosts than when fitting the whole sample (2.7σ significance). Larger samples will allow us to test the existence, the robustness, and the possible physical origin of this tentative difference (currently not significant in the full fit in the 3D space, which does not suffer from the intrinsic correlation between LIR, AGN/LIR, SFR and
  /LIR, SFR). For reference, we also show the cases of CO (7−6) and CO (2−1). We attempted a similar parameterization for the former, but the lack of coverage of high-contrast LIR, AGN/LIR, SFR sources returns results fully consistent with the known
  relation (e.g., Greve et al. 2014; Liu et al. 2015; V20a) and no reductions in the intrinsic scatter. We do not attempt any fit for CO (2−1), given the known sublinear dependence on LIR, SFR and its larger scatter or possible binomial distribution (Sargent et al. 2014).
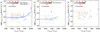 |
Fig. 10. CO emission as a function of the AGN-SFR contrast. |


The intended simplicity of our empirical prescription does not exhaust all possible explanations for the intrinsic scatter of the  relation, of course. Moreover, it does rely on specific assumptions, mainly the linear dependence on LIR, SFR and LIR, AGN and a fixed null intercept. Small deviations from linearity of the
  relations have been indeed reported (Liu et al. 2015; V20a). Fixing the intercept to zero is physically reasonable considering star formation and nuclear activity as the main direct (e.g., supernovae explosions, cosmic rays, X-rays) and indirect (e.g., shocks, turbulence) heating sources in distant massive galaxies. However, it is formally justified only with the certainty that the linear model is correct. We, thus, repeated the fitting procedure allowing for a free intercept obtaining α = 0.04 ± 0.02, which does not significantly deviate from our physically motivated choice of α = 0. If any, this intercept could be interpreted as a gauge of the validity of our assumption on the linearity. Finally, we remind the reader that the SED decomposition in presence of very luminous AGN, but scarce photometric coverage, is uncertain. Decisive improvement will come with mid-IR spectroscopy with James Webb Space Telescope and with systematic observations of galaxies with well determined SEDs. Probing the regime of high fAGN and spanning a large LIR, SFR interval will test our suggested relation and possibly extend it to higher-J CO transitions, where the effect of AGN is expected to be more significant.
5. Conclusions
We investigated the impact of AGN activity on the molecular gas and dust reservoirs in a sample of IR-selected galaxies on and above the main sequence at z ∼ 1.2. This is part of our ALMA campaign targeting multiple CO and [C I] transitions being carried out in order to offer a complete view of the gas masses and properties in galaxies representative of the bulk of the star-forming population approaching the peak of the cosmic star formation history.
-
We find that ∼30% of our IR-selected sample shows signatures of AGN activity as traced by a detailed decomposition of their SED at long wavelengths, an empirical color probing the mid-IR and the Rayleigh-Jeans regimes, and hard X-ray photon detections with Chandra.
-
The contribution of the AGN dust heating (fAGN = LIR, AGN/LIR) represents an important item in the total IR budget of a galaxy, and neglecting it can lead to severe overestimates of the SFR. In our sample, this is due to the excess power in the mid-IR portion of the SED, while we detect only very minor effects on its Rayleigh-Jeans tail. We do not find any significant suppression or enhancement of the SFR nor of the dust – and, thus, gas – masses in AGN hosts at fixed stellar masses.
-
The previous point is confirmed by the CO (2−1) and [C I] line luminosities – proxies for the molecular gas mass – of AGN hosts, which do not show any statistically significant departure from the general population of star-forming galaxies at similar redshifts and stellar masses. We do not retrieve any significant trend with the distance from the main sequence.
-
We also reach similar conclusions for mid-J CO (5−4) and CO (7−6) transitions and for the excitation conditions as probed by the R52 ratio and the average CO SLEDs, for which we do not see any appreciable difference between star-formation-dominated galaxies and AGN hosts in general. Heavy AGN obscuration as traced by the LIR, AGN/L2 − 10 keV ratio does not seem to play any role in determining the R52 ratio either. In addition, we do not see any effect on the [C I] ratio tracing the gas kinetic temperature, but with low number statistics. However, we retrieve a wide intrinsic variety of gas conditions as probed by the large dispersion of the R52 ratio and SLED shapes. Moreover, we find a handful of AGN hosts with large fAGN that are potentially over-luminous in CO (5−4) given their LIR, SFR.
-
We attempted to model the CO (5 − 4) emission as a linear combination of LIR, SFR and LIR, AGN, finding it capable of explaining the few outliers of the
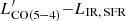 relation with large fAGN and reducing its intrinsic scatter. Systematic coverage of sources with well-sampled SEDs and a high contrast between the AGN-driven and star-formation-driven IR emission will validate or discourage the use of LIR, AGN or an analogous metric of the nuclear activity as secondary parameters to interpret the mid-J and higher CO transitions.
 -
We report a positive correlation between the fAGN and the wavelength at which the dust emission becomes optically thick, λ0(τ = 1) (2.8σ significance). The dust in galaxies hosting IR bright AGN thus reaches the optical thickness at longer wavelengths, but it rarely overcomes λ0 = 100 μm in our sample, guaranteeing robust dust mass estimates. This correlation is most likely driven by the mild tendency of AGN hosts to be compact, but more definitive results will come with larger samples.
-
We conclude that a widespread AGN activity is present in galaxies representative of the typical star-forming population and starbursts at z ∼ 1.2, but without any apparent major global effects on the SFR and gas or dust properties in the general population, with the exception of a handful of extreme cases. This might imply a common triggering mechanism for the star formation and AGN activity, but there is no obvious feedback stimulating or suppressing galaxy growth at this level. Our findings are partially at odds with previous studies that specifically focused on the brightest QSOs – often lensed and less obscured, and with evidence of massive outflows – for which lower fgas, higher SFEs, and more excited gas have been reported. However, our results are consistent with past works that targeted broader star-forming and SMG populations, despite the lack of coverage of more typical galaxies, such as the ones presented here. This stems from a combination of factors, but primarily from the sample selection. More massive and compact galaxies hosting brighter QSOs at stochastic peaks of their activity might be more affected by the growing SMBHs, while the more common activity linked to the lower luminosity AGN probed here does not appreciably affect the host.
Future observations, covering in particular CO transitions at high J, at high spatial resolution, and in large samples spanning a wide range of fAGN, will test our findings and address the issues on the coevolution of AGN and their hosts raised in this work.
Programs #2015.1.00260.S, #2016.1.00171.S (PI: Daddi), #2018.1.00635.S, #2016.1.01040.S, and #2019.1.01702.S. (PI: Valentino).
For a comparable use of this code in 2D fixing a constant slope, see Kilerci Eser et al. (2015).
Acknowledgments
We acknowledge the constructive comments from the anonymous referee that greatly improved the content and presentation of the results. We warmly thank Marianne Vestergaard for providing a modified version of the LINMIX_ERR.PRO routine for the linear regression with fixed slope and D. Elbaz and T. Wang for sharing their Herschel catalog of GOODS-S. F. V. acknowledges support from the Carlsberg Foundation Research Grant CF18-0388 “Galaxies: Rise and Death”. F. V. and G. E. M. acknowledge the Villum Fonden Research Grant 13160 “Gas to stars, stars to dust: tracing star formation across cosmic time” and the Cosmic Dawn Center of Excellence funded by the Danish National Research Foundation under then Grant No. 140. A. P. gratefully acknowledges financial support from STFC through grants ST/T000244/1 and ST/P000541/1. Y. G.’s work is partially supported by National Key Basic Research and Development Program of China (grant No. 2017YFA0402704), National Natural Science Foundation of China (NSFC, Nos. 12033004, and 11861131007), and Chinese Academy of Sciences Key Research Program of Frontier Sciences (grant No. QYZDJ-SSW-SLH008). M. A. acknowledges support from FONDECYT grant 1211951, “ANID+PCI+INSTITUTO MAX PLANCK DE ASTRONOMIA MPG 190030” and “ANID+PCI+REDES 190194. In this work, we made use of the COSMOS master spectroscopic catalog – kept updated by Mara Salvato –, of GILDAS, and STSDAS. GILDAS, the Grenoble Image and Line Data Analysis Software, is a joint effort of IRAM and the Observatoire de Grenoble. STSDAS is a product of the Space Telescope Science Institute, which is operated by AURA for NASA. Moreover, this paper makes use of the following ALMA data: ADS/JAO.ALMA, #2019.1.01702.S, #2018.1.00635.S, #2016.1.01040.S, #2016.1.00171.S, and #2015.1.00260.S. ALMA is a partnership of ESO (representing its member states), NSF (USA) and NINS (Japan), together with NRC (Canada), MOST and ASIAA (Taiwan), and KASI (Republic of Korea), in cooperation with the Republic of Chile. The Joint ALMA Observatory is operated by ESO, AUI/NRAO, and NAOJ.
References
- Aird, J., Coil, A. L., Georgakakis, A., et al. 2015, MNRAS, 451, 1892 [Google Scholar]
- Banerji, M., Jones, G. C., Wagg, J., et al. 2018, MNRAS, 479, 1154 [Google Scholar]
- Barnes, D. J., Kannan, R., Vogelsberger, M., & Marinacci, F. 2020, MNRAS, 494, 1143 [NASA ADS] [CrossRef] [Google Scholar]
- Bernhard, E., Tadhunter, C., Mullaney, J. R., et al. 2021, MNRAS, 503, 2598 [NASA ADS] [CrossRef] [Google Scholar]
- Biernacki, P., & Teyssier, R. 2018, MNRAS, 475, 5688 [NASA ADS] [CrossRef] [Google Scholar]
- Bisbas, T. G., Papadopoulos, P. P., & Viti, S. 2015, ApJ, 803, 37 [NASA ADS] [CrossRef] [Google Scholar]
- Bischetti, M., Feruglio, C., Piconcelli, E., et al. 2021, A&A, 645, A33 [NASA ADS] [CrossRef] [EDP Sciences] [Google Scholar]
- Blain, A. W., Barnard, V. E., & Chapman, S. C. 2003, MNRAS, 338, 733 [Google Scholar]
- Boogaard, L. A., van der Werf, P., Weiss, A., et al. 2020, ApJ, 902, 109 [NASA ADS] [CrossRef] [Google Scholar]
- Bothwell, M. S., Smail, I., Chapman, S. C., et al. 2013, MNRAS, 429, 3047 [Google Scholar]
- Brown, A., Nayyeri, H., Cooray, A., et al. 2019, ApJ, 871, 87 [NASA ADS] [CrossRef] [Google Scholar]
- Brusa, M., Cresci, G., Daddi, E., et al. 2018, A&A, 612, A29 [NASA ADS] [CrossRef] [EDP Sciences] [Google Scholar]
- Carilli, C. L., & Walter, F. 2013, ARA&A, 51, 105 [NASA ADS] [CrossRef] [Google Scholar]
- Carniani, S., Gallerani, S., Vallini, L., et al. 2019, MNRAS, 489, 3939 [NASA ADS] [Google Scholar]
- Casey, C. M., Narayanan, D., & Cooray, A. 2014, Phys. Rep., 541, 45 [Google Scholar]
- Chabrier, G. 2003, PASP, 115, 763 [Google Scholar]
- Cicone, C., Feruglio, C., Maiolino, R., et al. 2012, A&A, 543, A99 [NASA ADS] [CrossRef] [EDP Sciences] [Google Scholar]
- Cicone, C., Maiolino, R., Sturm, E., et al. 2014, A&A, 562, A21 [NASA ADS] [CrossRef] [EDP Sciences] [Google Scholar]
- Cicone, C., Brusa, M., Ramos Almeida, C., et al. 2018, Nat. Astron., 2, 176 [Google Scholar]
- Ciesla, L., Charmandaris, V., Georgakakis, A., et al. 2015, A&A, 576, A10 [NASA ADS] [CrossRef] [EDP Sciences] [Google Scholar]
- Circosta, C., Mainieri, V., Padovani, P., et al. 2018, A&A, 620, A82 [EDP Sciences] [Google Scholar]
- Circosta, C., Mainieri, V., Lamperti, I., et al. 2021, A&A, 646, A96 [EDP Sciences] [Google Scholar]
- Civano, F., Marchesi, S., Comastri, A., et al. 2016, ApJ, 819, 62 [Google Scholar]
- Cortzen, I., Magdis, G. E., Valentino, F., et al. 2020, A&A, 634, L14 [EDP Sciences] [Google Scholar]
- Costa, T., Pakmor, R., & Springel, V. 2020, MNRAS, 497, 5229 [Google Scholar]
- Croton, D. J., Springel, V., White, S. D. M., et al. 2006, MNRAS, 365, 11 [Google Scholar]
- Daddi, E., Dannerbauer, H., Liu, D., et al. 2015, A&A, 577, A46 [NASA ADS] [CrossRef] [EDP Sciences] [Google Scholar]
- D’Amato, Q., Gilli, R., Vignali, C., et al. 2020, A&A, 636, A37 [NASA ADS] [CrossRef] [EDP Sciences] [Google Scholar]
- Del Moro, A., Alexander, D. M., Bauer, F. E., et al. 2016, MNRAS, 456, 2105 [Google Scholar]
- Delvecchio, I., Daddi, E., Aird, J., et al. 2020, ApJ, 892, 17 [Google Scholar]
- Donley, J. L., Koekemoer, A. M., Brusa, M., et al. 2012, ApJ, 748, 142 [Google Scholar]
- Draine, B. T., & Li, A. 2007, ApJ, 657, 810 [NASA ADS] [CrossRef] [Google Scholar]
- Duras, F., Bongiorno, A., Ricci, F., et al. 2020, A&A, 636, A73 [NASA ADS] [CrossRef] [EDP Sciences] [Google Scholar]
- Elbaz, D., Leiton, R., Nagar, N., et al. 2018, A&A, 616, A110 [NASA ADS] [CrossRef] [EDP Sciences] [Google Scholar]
- Elvis, M., Wilkes, B. J., McDowell, J. C., et al. 1994, ApJS, 95, 1 [Google Scholar]
- Feruglio, C., Fiore, F., Carniani, S., et al. 2015, A&A, 583, A99 [NASA ADS] [CrossRef] [EDP Sciences] [Google Scholar]
- Fogasy, J., Knudsen, K. K., Drouart, G., Lagos, C. D. P., & Fan, L. 2020, MNRAS, 493, 3744 [NASA ADS] [CrossRef] [Google Scholar]
- Förster Schreiber, N. M., Genzel, R., Newman, S. F., et al. 2014, ApJ, 787, 38 [Google Scholar]
- Gabor, J. M., & Bournaud, F. 2014, MNRAS, 437, L56 [Google Scholar]
- Gallerani, S., Ferrara, A., Neri, R., & Maiolino, R. 2014, MNRAS, 445, 2848 [Google Scholar]
- Gandhi, P., Horst, H., Smette, A., et al. 2009, A&A, 502, 457 [NASA ADS] [CrossRef] [EDP Sciences] [Google Scholar]
- Greve, T. R., Leonidaki, I., Xilouris, E. M., et al. 2014, ApJ, 794, 142 [NASA ADS] [CrossRef] [Google Scholar]
- Harrington, K. C., Weiss, A., Yun, M. S., et al. 2021, ApJ, 908, 95 [NASA ADS] [CrossRef] [Google Scholar]
- Harrison, C. M. 2017, Nat. Astron., 1, 0165 [NASA ADS] [CrossRef] [Google Scholar]
- Harrison, C. M., Thomson, A. P., Alexander, D. M., et al. 2015, ApJ, 800, 45 [Google Scholar]
- Hickox, R. C., Mullaney, J. R., Alexander, D. M., et al. 2014, ApJ, 782, 9 [NASA ADS] [CrossRef] [Google Scholar]
- Hopkins, P. F., Hernquist, L., Cox, T. J., et al. 2006, ApJS, 163, 1 [Google Scholar]
- Israel, F. P., & Baas, F. 2002, A&A, 383, 82 [NASA ADS] [CrossRef] [EDP Sciences] [Google Scholar]
- Israel, F. P., Rosenberg, M. J. F., & van der Werf, P. 2015, A&A, 578, A95 [NASA ADS] [CrossRef] [EDP Sciences] [Google Scholar]
- Izumi, T., Nguyen, D. D., Imanishi, M., et al. 2020, ApJ, 898, 75 [NASA ADS] [CrossRef] [Google Scholar]
- Jarvis, M. E., Harrison, C. M., Thomson, A. P., et al. 2019, MNRAS, 485, 2710 [Google Scholar]
- Jarvis, M. E., Harrison, C. M., Mainieri, V., et al. 2020, MNRAS, 498, 1560 [NASA ADS] [CrossRef] [Google Scholar]
- Jiao, Q., Zhao, Y., Zhu, M., et al. 2017, ApJ, 840, L18 [Google Scholar]
- Jiao, Q., Zhao, Y., Lu, N., et al. 2019, ApJ, 880, 133 [Google Scholar]
- Jin, S., Daddi, E., Liu, D., et al. 2018, ApJ, 864, 56 [Google Scholar]
- Jin, S., Daddi, E., Magdis, G. E., et al. 2019, ApJ, 887, 144 [Google Scholar]
- Kakkad, D., Mainieri, V., Brusa, M., et al. 2017, MNRAS, 468, 4205 [Google Scholar]
- Kamenetzky, J., Rangwala, N., Glenn, J., Maloney, P. R., & Conley, A. 2016, ApJ, 829, 93 [Google Scholar]
- Kaplan, E. L., & Meier, P. 1958, J. Am. Stat. Assoc., 53, 457 [Google Scholar]
- Kelly, B. C. 2007, ApJ, 665, 1489 [Google Scholar]
- Kilerci Eser, E., Vestergaard, M., Peterson, B. M., Denney, K. D., & Bentz, M. C. 2015, ApJ, 801, 8 [NASA ADS] [CrossRef] [Google Scholar]
- Kirkpatrick, A., Alberts, S., Pope, A., et al. 2017, ApJ, 849, 111 [NASA ADS] [CrossRef] [Google Scholar]
- Kirkpatrick, A., Sharon, C., Keller, E., & Pope, A. 2019, ApJ, 879, 41 [NASA ADS] [CrossRef] [Google Scholar]
- Kokorev, V. I., Magdis, G. E., Davidzon, I., et al. 2021, ApJ, in press, [arXiv:2109.06209] [Google Scholar]
- Laigle, C., McCracken, H. J., Ilbert, O., et al. 2016, ApJS, 224, 24 [Google Scholar]
- Lehmer, B. D., Alexander, D. M., Bauer, F. E., et al. 2010, ApJ, 724, 559 [Google Scholar]
- Li, A., & Draine, B. T. 2001, ApJ, 554, 778 [Google Scholar]
- Liu, D., Gao, Y., Isaak, K., et al. 2015, ApJ, 810, L14 [NASA ADS] [CrossRef] [Google Scholar]
- Liu, D., Daddi, E., Schinnerer, E., et al. 2021, ApJ, 909, 56 [NASA ADS] [CrossRef] [Google Scholar]
- Lu, N., Zhao, Y., Xu, C. K., et al. 2014, ApJ, 787, L23 [Google Scholar]
- Lu, N., Zhao, Y., Xu, C. K., et al. 2015, ApJ, 802, L11 [Google Scholar]
- Lu, N., Zhao, Y., Díaz-Santos, T., et al. 2017, ApJS, 230, 1 [Google Scholar]
- Lusso, E., Comastri, A., Vignali, C., et al. 2011, A&A, 534, A110 [NASA ADS] [CrossRef] [EDP Sciences] [Google Scholar]
- Lusso, E., Comastri, A., Simmons, B. D., et al. 2012, MNRAS, 425, 623 [Google Scholar]
- Lutz, D., Poglitsch, A., Altieri, B., et al. 2011, A&A, 532, A90 [NASA ADS] [CrossRef] [EDP Sciences] [Google Scholar]
- Madden, S. C., Cormier, D., Hony, S., et al. 2020, A&A, 643, A141 [NASA ADS] [CrossRef] [EDP Sciences] [Google Scholar]
- Magdis, G. E., Daddi, E., Béthermin, M., et al. 2012, ApJ, 760, 6 [NASA ADS] [CrossRef] [Google Scholar]
- Magdis, G. E., Rigopoulou, D., Daddi, E., et al. 2017, A&A, 603, A93 [NASA ADS] [CrossRef] [EDP Sciences] [Google Scholar]
- Marchesi, S., Civano, F., Elvis, M., et al. 2016, ApJ, 817, 34 [Google Scholar]
- Mashian, N., Sturm, E., Sternberg, A., et al. 2015, ApJ, 802, 81 [Google Scholar]
- Meijerink, R., Spaans, M., & Israel, F. P. 2007, A&A, 461, 793 [NASA ADS] [CrossRef] [EDP Sciences] [Google Scholar]
- Meijerink, R., Kristensen, L. E., Weiß, A., et al. 2013, ApJ, 762, L16 [Google Scholar]
- Mullaney, J. R., Alexander, D. M., Goulding, A. D., & Hickox, R. C. 2011, MNRAS, 414, 1082 [Google Scholar]
- Mullaney, J. R., Pannella, M., Daddi, E., et al. 2012, MNRAS, 419, 95 [NASA ADS] [CrossRef] [Google Scholar]
- Muzzin, A., Wilson, G., Demarco, R., et al. 2013, ApJ, 767, 39 [NASA ADS] [CrossRef] [Google Scholar]
- Narayanan, D., & Krumholz, M. R. 2014, MNRAS, 442, 1411 [NASA ADS] [CrossRef] [Google Scholar]
- Noll, S., Pierini, D., Cimatti, A., et al. 2009, A&A, 499, 69 [NASA ADS] [CrossRef] [EDP Sciences] [Google Scholar]
- Papadopoulos, P. P., Thi, W.-F., & Viti, S. 2004, MNRAS, 351, 147 [Google Scholar]
- Papadopoulos, P. P., Bisbas, T. G., & Zhang, Z.-Y. 2018, MNRAS, 478, 1716 [NASA ADS] [CrossRef] [Google Scholar]
- Perna, M., Brusa, M., Salvato, M., et al. 2015, A&A, 583, A72 [NASA ADS] [CrossRef] [EDP Sciences] [Google Scholar]
- Perna, M., Sargent, M. T., Brusa, M., et al. 2018, A&A, 619, A90 [NASA ADS] [CrossRef] [EDP Sciences] [Google Scholar]
- Puglisi, A., Daddi, E., Liu, D., et al. 2019, ApJ, 877, L23 [Google Scholar]
- Puglisi, A., Daddi, E., Valentino, F., et al. 2021a, MNRAS, in press, [arXiv:2103.12035] [Google Scholar]
- Puglisi, A., Daddi, E., Brusa, M., et al. 2021b, Nat. Astron., 5, 319 [Google Scholar]
- Ranalli, P., Comastri, A., & Setti, G. 2003, A&A, 399, 39 [NASA ADS] [CrossRef] [EDP Sciences] [Google Scholar]
- Rodighiero, G., Daddi, E., Baronchelli, I., et al. 2011, ApJ, 739, L40 [Google Scholar]
- Roos, O., Juneau, S., Bournaud, F., & Gabor, J. M. 2015, ApJ, 800, 19 [NASA ADS] [CrossRef] [Google Scholar]
- Rosenberg, M. J. F., van der Werf, P. P., Aalto, S., et al. 2015, ApJ, 801, 72 [Google Scholar]
- Saintonge, A., Tacconi, L. J., Fabello, S., et al. 2012, ApJ, 758, 73 [Google Scholar]
- Sargent, M. T., Daddi, E., Béthermin, M., et al. 2014, ApJ, 793, 19 [NASA ADS] [CrossRef] [Google Scholar]
- Schulze, A., Silverman, J. D., Daddi, E., et al. 2019, MNRAS, 488, 1180 [NASA ADS] [CrossRef] [Google Scholar]
- Scoville, N., Aussel, H., Brusa, M., et al. 2007, ApJS, 172, 1 [Google Scholar]
- Scoville, N., Sheth, K., Aussel, H., et al. 2016, ApJ, 820, 83 [Google Scholar]
- Scoville, N., Murchikova, L., Walter, F., et al. 2017, ApJ, 836, 66 [Google Scholar]
- Shangguan, J., Ho, L. C., Bauer, F. E., Wang, R., & Treister, E. 2020, ApJ, 899, 112 [NASA ADS] [CrossRef] [Google Scholar]
- Shanks, T., Ansarinejad, B., Bielby, R. M., et al. 2021, MNRAS, 505, 1509 [NASA ADS] [CrossRef] [Google Scholar]
- Sharon, C. E., Riechers, D. A., Hodge, J., et al. 2016, ApJ, 827, 18 [Google Scholar]
- Silk, J. 2013, ApJ, 772, 112 [Google Scholar]
- Simpson, J. M., Smail, I., Wang, W.-H., et al. 2017, ApJ, 844, L10 [Google Scholar]
- Solomon, P. M., & Vanden Bout, P. A. 2005, ARA&A, 43, 677 [NASA ADS] [CrossRef] [Google Scholar]
- Spilker, J. S., Marrone, D. P., Aguirre, J. E., et al. 2014, ApJ, 785, 149 [NASA ADS] [CrossRef] [Google Scholar]
- Spilker, J. S., Marrone, D. P., Aravena, M., et al. 2016, ApJ, 826, 112 [NASA ADS] [CrossRef] [Google Scholar]
- Stanley, F., Harrison, C. M., Alexander, D. M., et al. 2015, MNRAS, 453, 591 [Google Scholar]
- Stanley, F., Alexander, D. M., Harrison, C. M., et al. 2017, MNRAS, 472, 2221 [Google Scholar]
- Symeonidis, M. 2017, MNRAS, 465, 1401 [Google Scholar]
- Symeonidis, M., Giblin, B. M., Page, M. J., et al. 2016, MNRAS, 459, 257 [Google Scholar]
- Tacconi, L. J., Genzel, R., Saintonge, A., et al. 2018, ApJ, 853, 179 [Google Scholar]
- Talia, M., Pozzi, F., Vallini, L., et al. 2018, MNRAS, 476, 3956 [NASA ADS] [CrossRef] [Google Scholar]
- Torrey, P., Hopkins, P. F., Faucher-Giguère, C.-A., et al. 2020, MNRAS, 497, 5292 [NASA ADS] [CrossRef] [Google Scholar]
- Valentino, F., Magdis, G. E., Daddi, E., et al. 2018, ApJ, 869, 27 [Google Scholar]
- Valentino, F., Daddi, E., Puglisi, A., et al. 2020a, A&A, 641, A155 [NASA ADS] [CrossRef] [EDP Sciences] [Google Scholar]
- Valentino, F., Magdis, G. E., Daddi, E., et al. 2020b, ApJ, 890, 24 [Google Scholar]
- Vallini, L., Tielens, A. G. G. M., Pallottini, A., et al. 2019, MNRAS, 490, 4502 [CrossRef] [Google Scholar]
- van der Wel, A., Franx, M., van Dokkum, P. G., et al. 2014, ApJ, 788, 28 [Google Scholar]
- van der Werf, P. P., Isaak, K. G., Meijerink, R., et al. 2010, A&A, 518, L42 [NASA ADS] [CrossRef] [EDP Sciences] [Google Scholar]
- Vasudevan, R. V., & Fabian, A. C. 2007, MNRAS, 381, 1235 [NASA ADS] [CrossRef] [Google Scholar]
- Veilleux, S., Maiolino, R., Bolatto, A. D., & Aalto, S. 2020, A&ARv, 28, 2 [NASA ADS] [CrossRef] [Google Scholar]
- Walter, F., Weiß, A., Downes, D., Decarli, R., & Henkel, C. 2011, ApJ, 730, 18 [Google Scholar]
- Weiß, A., Downes, D., Henkel, C., & Walter, F. 2005, A&A, 429, L25 [NASA ADS] [CrossRef] [EDP Sciences] [Google Scholar]
- Weiß, A., Downes, D., Neri, R., et al. 2007, A&A, 467, 955 [NASA ADS] [CrossRef] [EDP Sciences] [Google Scholar]
- Weiss, A., Downes, D., Walter, F., & Henkel, C. 2007, in From Z-Machines to ALMA: (Sub)Millimeter Spectroscopy of Galaxies, eds. A. J. Baker, J. Glenn, A. I. Harris, J. G. Mangum, & M. S. Yun, ASP Conf. Ser., 375, 25 [NASA ADS] [Google Scholar]
- Yesuf, H. M., & Ho, L. C. 2020, ApJ, 901, 42 [NASA ADS] [CrossRef] [Google Scholar]
Appendix A: Data table
The data used in this work are release at the CDS. The description of the table columns is reported in Table A.1. More information can be found in the master table released in Valentino et al. (2020a) (e.g., ALMA continuum emission measurements). Whenever a difference between this and the master table is present, the updated estimates in this work supersede the previous version. Significant variations exclusively concern the far-IR SED modeling of a handful of AGN with extreme fAGN, as described in Sect. 2.
Column description for the data release.
Appendix B: Supplementary figures
We collect here further plots that might help guide the reader through more technical aspects of the analysis in this work.
B.1. Correlation between the X-ray luminosity and IR emission in AGN hosts
In Fig. B.1 we show the relation between the AGN contribution to the total IR luminosity fAGN = LIR, AGN/LIR and the X-ray luminosity in the 2−10 keV band for the sources in our sample detected by Chandra (Civano et al. 2016; Marchesi et al. 2016). The correlation supports the use of both variables as indicators of AGN activity and justifies our choice to fix the fAGN+1σfAGN threshold at 20% to broadly classify objects as AGN hosts or star-forming galaxies (Sect. 3.1).
 |
Fig. B.1. X-ray luminosity L2 − 10 keV as a function of the AGN contribution to the far-IR emission. The symbols represent our sample at z ∼ 1.2 and are color coded according to fAGN as in previous figures. The arrow marks the floor of fAGN = 1% adopted in this work. The solid orange star indicates the object from Brusa et al. (2018), which is part of our parent sample. |
B.2. Stellar masses
In Fig. B.2, we show the stellar masses for our sample of z ∼ 1.2 galaxies as a function of LIR, AGN. Despite the large scatter, AGN hosts appear to have lower stellar masses in our sample, reflecting the IR selection and AGN classification (Sect. 3.1). We stress that deriving stellar masses for optically bright AGN is prone to significant uncertainties. In Fig. B.2, we also show the comparison between estimates of M⋆ from the public COSMOS catalogs (Muzzin et al. 2013; Laigle et al. 2016) against a refit with CIGALE that includes AGN templates as in Circosta et al. (2018). For the object presented in Brusa et al. (2018), we used their original fit including AGN templates (Perna et al. 2015, and references therein). The AGN component is allowed for every source with AGN signatures from X-ray or mid-IR observations. While not significantly introducing any systematic bias for star-forming galaxies, the use of a code that allows for a consistent AGN treatment improves the stellar mass estimates of their hosts. This happens both removing the strongest and unphysical outliers at low M⋆ and reducing the estimates for the objects with the largest fAGN values due to the proper decomposition of the AGN and stellar contributions.
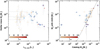 |
Fig. B.2. Detectability of AGN signatures at different stellar masses. Left: stellar mass as a function of the IR luminosity attributed to the AGN emission LIR, AGN. The symbols represent our sample at z ∼ 1.2 and are color coded according to fAGN as in previous figures. Empty blue circles indicate X-ray detections. Arrows mark the floor of fAGN = 1% adopted in this work. A similar picture is offered when using L2 − 10 keV as a proxy for the AGN emission in lieu of LIR, AGN. Right: stellar masses from the standard stellar population synthesis modeling (Muzzin et al. 2013; Laigle et al. 2016) compared with results obtained by following Circosta et al. (2018). Symbols and colors are the same as in the left panel. |
B.3. Individual spectral line energy distributions
In Fig. B.3 we show the individual CO SLEDs of all the CO (2 − 1) detected objects in this study, classified as AGN hosts and star-forming galaxies according to a threshold in fAGN of 20% and a Chandra detection at 2−10 keV.
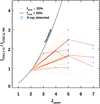 |
Fig. B.3. Individual CO spectral line distributions of AGN hosts and star-forming galaxies and individual SLEDs for AGN hosts and star-forming galaxies normalized to the average CO (2 − 1) flux of main-sequence galaxies at z ∼ 1.2 from V20a. Yellow and red lines indicate galaxies in our sample with fAGN ≤ 20% and > 20%, respectively. Open blue circles show Chandra detections at 2−10 keV. |
Average SLEDs for star-forming galaxies and AGN hosts at z ∼ 1.25.
All Tables
All Figures
|
Fig. 1. Star-formation and AGN contributions to the total IR luminosities LIR(8 − 1000 μm). Left: our sample of galaxies at z ∼ 1.2, indicated by filled circles and color coded according to the AGN contribution to LIR (fAGN = LIR, AGN/LIR). Blue circles show hard X-ray emitters with L2 − 10 keV > 1043 erg s−1 detected by Chandra. The orange filled star marks the object from Brusa et al. (2018), which is part of our parent sample. The colored lines show the limits for fAGN as labeled. Center, right: rest-frame far-IR SEDs normalized to LIR(8 − 1000 μm) = 1 L⊙ and color coded according to fAGN (central panel) and X-ray detection (right panel). Gray diamonds and arrows show detections and 3σ upper limits on the photometry, respectively. We note that the emission at radio wavelengths is not included in the modeling. |
| In the text | |
|
Fig. 2. How observed colors, the full far-IR SED modeling, and X-ray detections compare as tracers of the AGN activity. Top: observed S1.2 mm/S24 μm color (Rayleigh-Jeans/mid-IR rest-frame color) as a function of fAGN and the X-ray luminosity L2 − 10 keV. Bottom left: AGN IR luminosity from SED modeling as a function of L2 − 10 keV. The black line indicates the locus of constant bolometric luminosities derived from X-ray and IR luminosities adopting the corrections as labeled. Bottom right: Spitzer/IRAC S8 μm/S4.5 μm, S5.8 μm/S3.6 μm selection as in Donley et al. (2012). The symbols indicate our sample of z ∼ 1.2 galaxies color coded by fAGN as in previous figures. Open blue circles mark hard X-ray emitters with L2 − 10 keV > 1043 erg s−1. In the top panels, arrows indicate 3σ upper limits on the ALMA continuum emission at 1.2 mm. |
| In the text | |
|
Fig. 3. AGN effect on CO line emission. Left column, from top to bottom: CO (2 − 1), CO (5−4) luminosities and their ratio as a function of the IR luminosities from the star-forming component LIR, SFR. Right column: CO (2 − 1)/LIR, SFR, CO (5 − 4)/LIR, SFR, and CO (2 − 1)/CO (5−4) luminosity ratios as a function of the distance from the main sequence as parameterized in Sargent et al. (2014) (blue area and vertical solid line). Filled circles mark our sample at z ∼ 1.2 color coded according to fAGN. Empty blue circles show hard X-ray emitters with L2 − 10 keV > 1043 erg s−1 detected by Chandra. The orange filled star marks the object from Brusa et al. (2018), which is part of our parent sample. Open triangles and squares represent local objects and distant SMGs from Liu et al. (2021) color coded according to fAGN. Filled squares indicate the ASPECS sample, with X-ray AGN marked with blue empty squares (Boogaard et al. 2020). The gray and green dashes mark the R52 for the average SLED of distant QSOs in Carilli & Walter (2013) and Mrk 231 (van der Werf et al. 2010), respectively. Solid black lines show the loci of main-sequence and starburst galaxies in Sargent et al. (2014) (top left panel) or the best-fit relations in V20a, as labeled. The solid blue and yellow lines in the right column show the kernel density estimation (KDE) of the properties on the Y axis for Chandra-detected AGN and star-forming galaxies normalized to their relative frequency and rescaled for visibility. Only detections are included in the KDE. |
| In the text | |
|
Fig. 4. CO line excitation (R52) as a function of a proxy for heavy obscuration (LIR, AGN/L2 − 10 keV). LIR, AGN and L2 − 10 keV have both been corrected to the total bolometric output by factors of 1.5 and 22.5, respectively. The symbols represent our sample at z ∼ 1.2 and are color coded as in the previous figures. |
| In the text | |
|
Fig. 5. Average CO spectral line distributions of AGN hosts and star-forming galaxies as well as average SLEDs for AGN hosts and star-forming galaxies normalized to the average CO (2 − 1) flux of main-sequence galaxies at z ∼ 1.2 from V20a. Filled yellow and red circles indicate galaxies in our sample with fAGN ≤ 20% and > 20%, respectively. Open yellow and red circles show objects split according to their Chandra detection at 2−10 keV. Blue open squares represent the SLEDs of the main sequence and (extreme) starbursts (> 7×) > 3.5× above the main sequence from V20a. Filled light and empty dark green stars show the average SLEDs from the stacking in Kirkpatrick et al. (2019), splitting AGN hosts and star-forming at fAGN, mid-IR = 50% (comparable with our fAGN = 20% threshold; see their Eq. (1)). The dashed gray line marks the QSO SLED in Carilli & Walter (2013). The L′ luminosity values for our samples are reported in Table B.1. We note that the statistics of X-ray detections of AGN with measurements of CO (4 − 3) are not sufficient to derive an average estimate. |
| In the text | |
|
Fig. 6. AGN effect on [C I] emission: [C I](3P1 − 3P0) and [C I](3P2 − 3P1) L′ luminosities and their ratio as a function of the IR luminosities from the star-forming component LIR, SFR. Filled and empty blue circles mark our sample at z ∼ 1.2 as in previous figures. Squares indicate the sample in Valentino et al. (2018), selected at similar redshift and luminosity. |
| In the text | |
|
Fig. 7. Effect of AGN on the dust fraction and opacity. Left: dust fraction Mdust/M⋆ as a function of LIR, AGN. Right: wavelength at which the dust optical depth reaches unity as a function of fAGN. Symbols and colors mark our sample at z ∼ 1.2 as in previous figures. |
| In the text | |
|
Fig. 8. Compactness of AGN hosts. Distance from the optical mass-size relation for late-type galaxies expressed as Reff/RLTG as parameterized in van der Wel et al. (2014) as a function of fAGN. The symbols represent our sample at z ∼ 1.2 color coded according to fAGN as in the previous figures. |
| In the text | |
|
Fig. 9. LIR, SFR, LIR, AGN, and |
| In the text | |
|
Fig. 10. CO emission as a function of the AGN-SFR contrast. |
| In the text | |
|
Fig. B.1. X-ray luminosity L2 − 10 keV as a function of the AGN contribution to the far-IR emission. The symbols represent our sample at z ∼ 1.2 and are color coded according to fAGN as in previous figures. The arrow marks the floor of fAGN = 1% adopted in this work. The solid orange star indicates the object from Brusa et al. (2018), which is part of our parent sample. |
| In the text | |
|
Fig. B.2. Detectability of AGN signatures at different stellar masses. Left: stellar mass as a function of the IR luminosity attributed to the AGN emission LIR, AGN. The symbols represent our sample at z ∼ 1.2 and are color coded according to fAGN as in previous figures. Empty blue circles indicate X-ray detections. Arrows mark the floor of fAGN = 1% adopted in this work. A similar picture is offered when using L2 − 10 keV as a proxy for the AGN emission in lieu of LIR, AGN. Right: stellar masses from the standard stellar population synthesis modeling (Muzzin et al. 2013; Laigle et al. 2016) compared with results obtained by following Circosta et al. (2018). Symbols and colors are the same as in the left panel. |
| In the text | |
|
Fig. B.3. Individual CO spectral line distributions of AGN hosts and star-forming galaxies and individual SLEDs for AGN hosts and star-forming galaxies normalized to the average CO (2 − 1) flux of main-sequence galaxies at z ∼ 1.2 from V20a. Yellow and red lines indicate galaxies in our sample with fAGN ≤ 20% and > 20%, respectively. Open blue circles show Chandra detections at 2−10 keV. |
| In the text | |
Current usage metrics show cumulative count of Article Views (full-text article views including HTML views, PDF and ePub downloads, according to the available data) and Abstracts Views on Vision4Press platform.
Data correspond to usage on the plateform after 2015. The current usage metrics is available 48-96 hours after online publication and is updated daily on week days.
Initial download of the metrics may take a while.