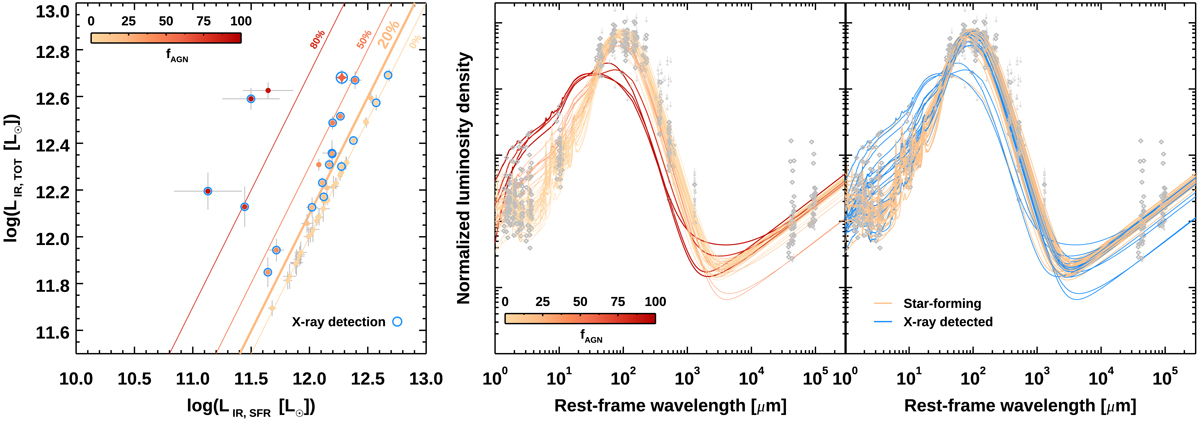
Fig. 1.
Download original image
Star-formation and AGN contributions to the total IR luminosities LIR(8 − 1000 μm). Left: our sample of galaxies at z ∼ 1.2, indicated by filled circles and color coded according to the AGN contribution to LIR (fAGN = LIR, AGN/LIR). Blue circles show hard X-ray emitters with L2 − 10 keV > 1043 erg s−1 detected by Chandra. The orange filled star marks the object from Brusa et al. (2018), which is part of our parent sample. The colored lines show the limits for fAGN as labeled. Center, right: rest-frame far-IR SEDs normalized to LIR(8 − 1000 μm) = 1 L⊙ and color coded according to fAGN (central panel) and X-ray detection (right panel). Gray diamonds and arrows show detections and 3σ upper limits on the photometry, respectively. We note that the emission at radio wavelengths is not included in the modeling.
Current usage metrics show cumulative count of Article Views (full-text article views including HTML views, PDF and ePub downloads, according to the available data) and Abstracts Views on Vision4Press platform.
Data correspond to usage on the plateform after 2015. The current usage metrics is available 48-96 hours after online publication and is updated daily on week days.
Initial download of the metrics may take a while.