Fig. 3.
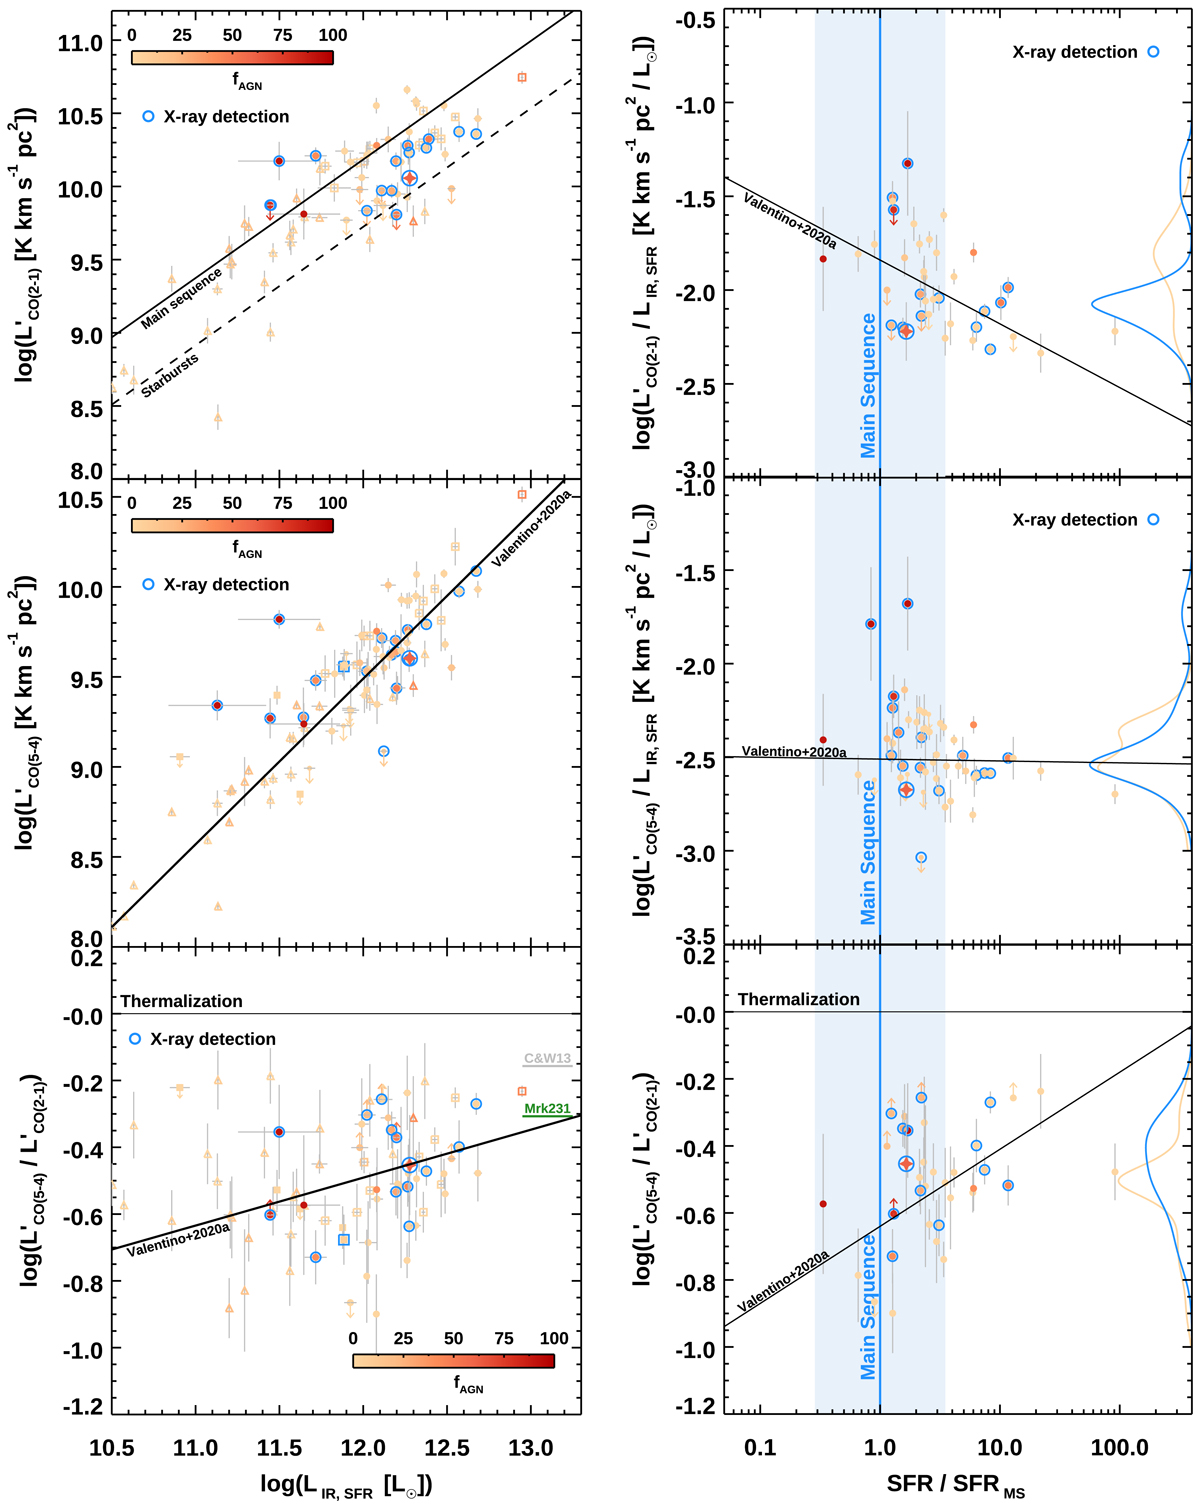
Download original image
AGN effect on CO line emission. Left column, from top to bottom: CO (2 − 1), CO (5−4) luminosities and their ratio as a function of the IR luminosities from the star-forming component LIR, SFR. Right column: CO (2 − 1)/LIR, SFR, CO (5 − 4)/LIR, SFR, and CO (2 − 1)/CO (5−4) luminosity ratios as a function of the distance from the main sequence as parameterized in Sargent et al. (2014) (blue area and vertical solid line). Filled circles mark our sample at z ∼ 1.2 color coded according to fAGN. Empty blue circles show hard X-ray emitters with L2 − 10 keV > 1043 erg s−1 detected by Chandra. The orange filled star marks the object from Brusa et al. (2018), which is part of our parent sample. Open triangles and squares represent local objects and distant SMGs from Liu et al. (2021) color coded according to fAGN. Filled squares indicate the ASPECS sample, with X-ray AGN marked with blue empty squares (Boogaard et al. 2020). The gray and green dashes mark the R52 for the average SLED of distant QSOs in Carilli & Walter (2013) and Mrk 231 (van der Werf et al. 2010), respectively. Solid black lines show the loci of main-sequence and starburst galaxies in Sargent et al. (2014) (top left panel) or the best-fit relations in V20a, as labeled. The solid blue and yellow lines in the right column show the kernel density estimation (KDE) of the properties on the Y axis for Chandra-detected AGN and star-forming galaxies normalized to their relative frequency and rescaled for visibility. Only detections are included in the KDE.
Current usage metrics show cumulative count of Article Views (full-text article views including HTML views, PDF and ePub downloads, according to the available data) and Abstracts Views on Vision4Press platform.
Data correspond to usage on the plateform after 2015. The current usage metrics is available 48-96 hours after online publication and is updated daily on week days.
Initial download of the metrics may take a while.