Fig. 2.
Download original image
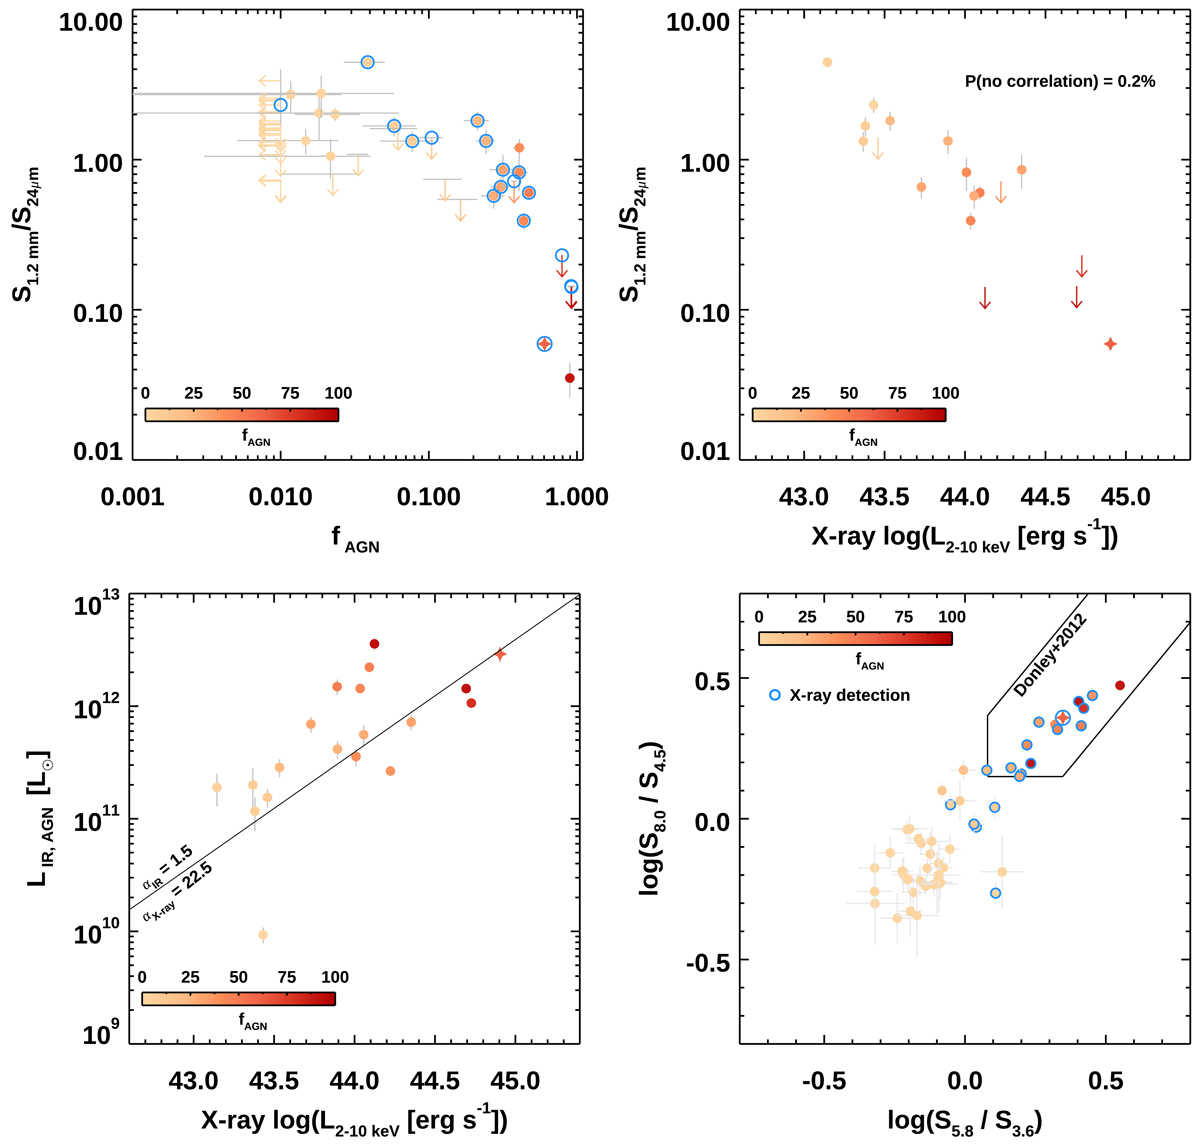
How observed colors, the full far-IR SED modeling, and X-ray detections compare as tracers of the AGN activity. Top: observed S1.2 mm/S24 μm color (Rayleigh-Jeans/mid-IR rest-frame color) as a function of fAGN and the X-ray luminosity L2 − 10 keV. Bottom left: AGN IR luminosity from SED modeling as a function of L2 − 10 keV. The black line indicates the locus of constant bolometric luminosities derived from X-ray and IR luminosities adopting the corrections as labeled. Bottom right: Spitzer/IRAC S8 μm/S4.5 μm, S5.8 μm/S3.6 μm selection as in Donley et al. (2012). The symbols indicate our sample of z ∼ 1.2 galaxies color coded by fAGN as in previous figures. Open blue circles mark hard X-ray emitters with L2 − 10 keV > 1043 erg s−1. In the top panels, arrows indicate 3σ upper limits on the ALMA continuum emission at 1.2 mm.
Current usage metrics show cumulative count of Article Views (full-text article views including HTML views, PDF and ePub downloads, according to the available data) and Abstracts Views on Vision4Press platform.
Data correspond to usage on the plateform after 2015. The current usage metrics is available 48-96 hours after online publication and is updated daily on week days.
Initial download of the metrics may take a while.