Fig. 10.
Download original image
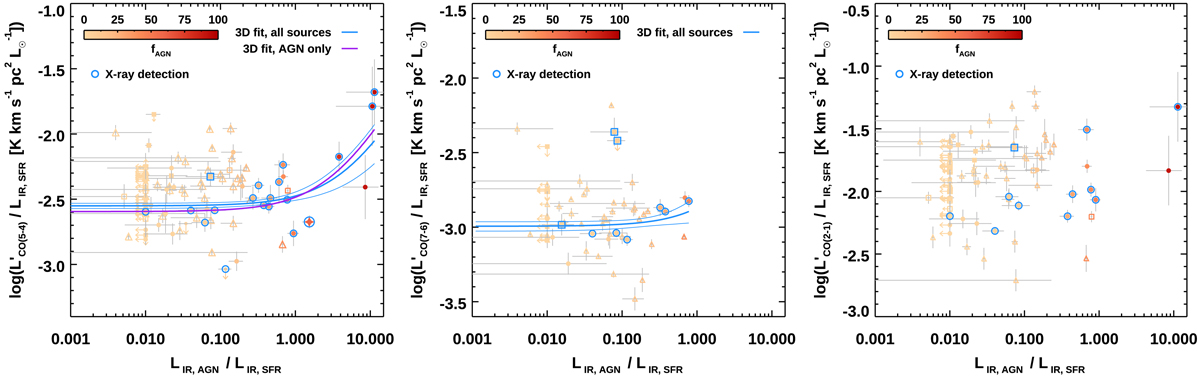
CO emission as a function of the AGN-SFR contrast. ![]() ratios as a function of the contrast between the AGN and star formation contributions to the total IR budget for CO (5 − 4), CO (7 − 6), and CO (2 − 1) (from left to right). The symbols mark our sample of galaxies at z ∼ 1.2 and galaxies from the literature (Boogaard et al. 2020; Liu et al. 2021) as in previous figures, color coded according to fAGN. Vertical arrows mark 3σ upper limits on
ratios as a function of the contrast between the AGN and star formation contributions to the total IR budget for CO (5 − 4), CO (7 − 6), and CO (2 − 1) (from left to right). The symbols mark our sample of galaxies at z ∼ 1.2 and galaxies from the literature (Boogaard et al. 2020; Liu et al. 2021) as in previous figures, color coded according to fAGN. Vertical arrows mark 3σ upper limits on ![]() , and horizontal arrows show the floor of fAGN that we considered for the high-redshift galaxies. Blue open symbols indicate X-ray detections. The solid blue lines indicate the projection of the best-fit plane models with fixed null intercept in the 3D space of LIR, SFR, LIR, AGN, and
, and horizontal arrows show the floor of fAGN that we considered for the high-redshift galaxies. Blue open symbols indicate X-ray detections. The solid blue lines indicate the projection of the best-fit plane models with fixed null intercept in the 3D space of LIR, SFR, LIR, AGN, and ![]() for CO (5−4) (Eq. (2)) and CO (7 − 6). The solid purple line in the left panel indicates the projection of the best-fit model for AGN hosts with fAGN + 1σfAGN > 20% or X-ray detected. The absence of points with LIR, AGN/LIR, SFR > 1 in the central panel is due to the lack of CO (7 − 6) coverage.
for CO (5−4) (Eq. (2)) and CO (7 − 6). The solid purple line in the left panel indicates the projection of the best-fit model for AGN hosts with fAGN + 1σfAGN > 20% or X-ray detected. The absence of points with LIR, AGN/LIR, SFR > 1 in the central panel is due to the lack of CO (7 − 6) coverage.
Current usage metrics show cumulative count of Article Views (full-text article views including HTML views, PDF and ePub downloads, according to the available data) and Abstracts Views on Vision4Press platform.
Data correspond to usage on the plateform after 2015. The current usage metrics is available 48-96 hours after online publication and is updated daily on week days.
Initial download of the metrics may take a while.