Fig. 9.
Download original image
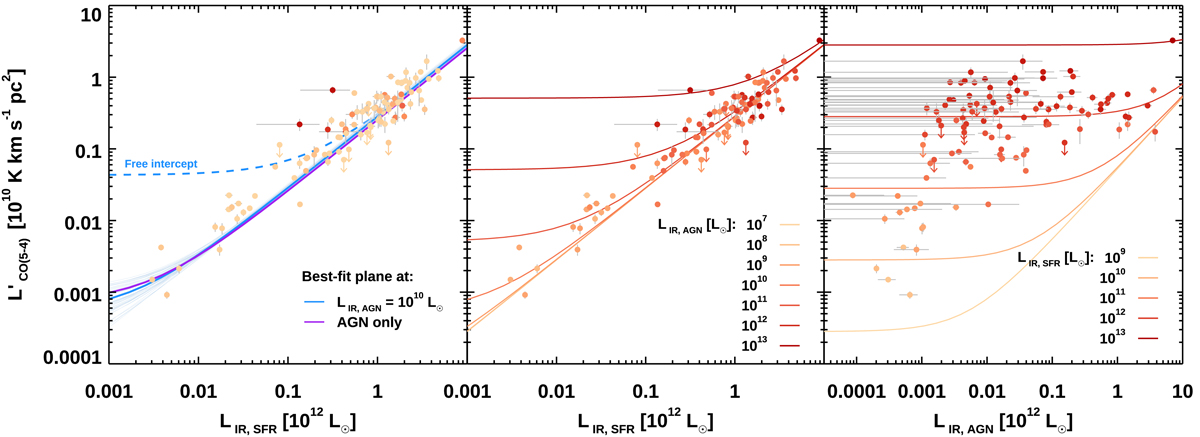
LIR, SFR, LIR, AGN, and ![]() plane. Left:
plane. Left: ![]() as a function of LIR, SFR. The filled circles and arrows mark the compilation of our measurements and 3σ upper limits at z ∼ 1.2 and from the literature (Boogaard et al. 2020; Liu et al. 2021), color coded based on fAGN. The thick blue lines indicate the best linear fit to the whole sample at the median LIR, AGN = 1010 L⊙ with intercept fixed to α = 0 (Eq. (2), solid line) or free to vary (dashed line). Thin blue lines represent random extractions from the posterior distribution of the best-fit model with fixed intercept α = 0. The purple line shows the best fit with fixed intercept for the sample of galaxies with fAGN + 1σfAGN > 20% or an X-ray detection. Center:
as a function of LIR, SFR. The filled circles and arrows mark the compilation of our measurements and 3σ upper limits at z ∼ 1.2 and from the literature (Boogaard et al. 2020; Liu et al. 2021), color coded based on fAGN. The thick blue lines indicate the best linear fit to the whole sample at the median LIR, AGN = 1010 L⊙ with intercept fixed to α = 0 (Eq. (2), solid line) or free to vary (dashed line). Thin blue lines represent random extractions from the posterior distribution of the best-fit model with fixed intercept α = 0. The purple line shows the best fit with fixed intercept for the sample of galaxies with fAGN + 1σfAGN > 20% or an X-ray detection. Center: ![]() plane, with symbols marking the same sample as in the left panel but now color coded according to LIR, AGN. Solid lines indicate the loci of the best-fit model of Eq. (2) at fixed LIR, AGN as labeled and color coded as the individual symbols. Right:
plane, with symbols marking the same sample as in the left panel but now color coded according to LIR, AGN. Solid lines indicate the loci of the best-fit model of Eq. (2) at fixed LIR, AGN as labeled and color coded as the individual symbols. Right: ![]() plane, with symbols marking the same sample as in the other panels but now color coded according to LIR, SFR. Solid lines indicate the loci of the best-fit model of Eq. (2) at fixed LIR, SFR as labeled and color coded as the individual symbols. We report the gray error bars on LIR, AGN to show the weighting scheme implemented for sources with fAGN < 1%.
plane, with symbols marking the same sample as in the other panels but now color coded according to LIR, SFR. Solid lines indicate the loci of the best-fit model of Eq. (2) at fixed LIR, SFR as labeled and color coded as the individual symbols. We report the gray error bars on LIR, AGN to show the weighting scheme implemented for sources with fAGN < 1%.
Current usage metrics show cumulative count of Article Views (full-text article views including HTML views, PDF and ePub downloads, according to the available data) and Abstracts Views on Vision4Press platform.
Data correspond to usage on the plateform after 2015. The current usage metrics is available 48-96 hours after online publication and is updated daily on week days.
Initial download of the metrics may take a while.