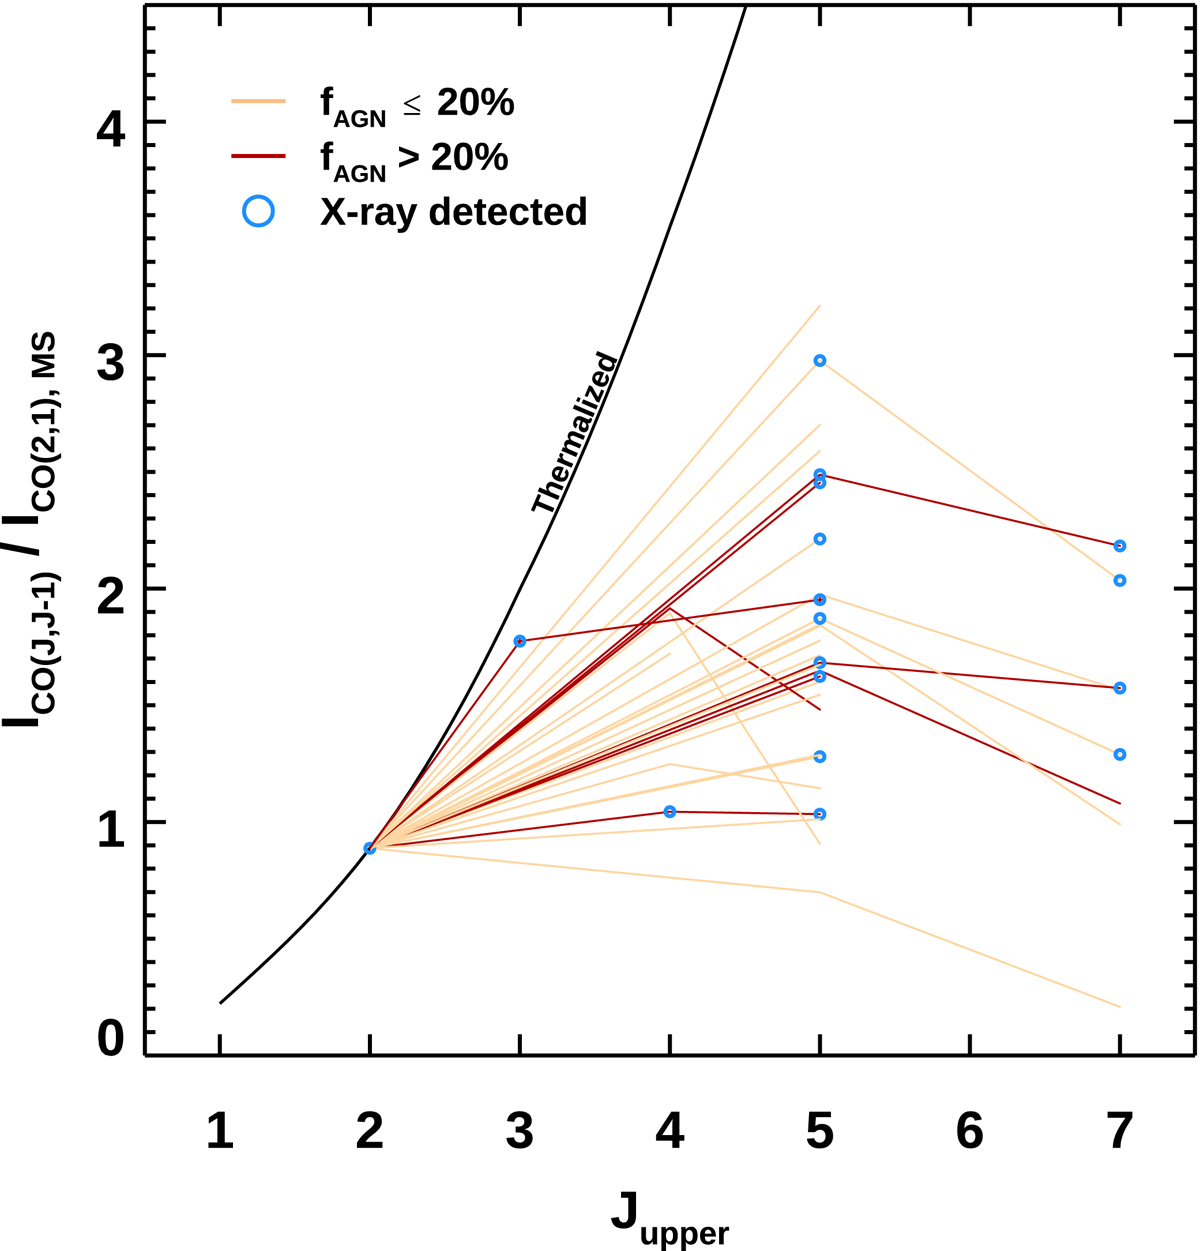
Fig. B.3.
Download original image
Individual CO spectral line distributions of AGN hosts and star-forming galaxies and individual SLEDs for AGN hosts and star-forming galaxies normalized to the average CO (2 − 1) flux of main-sequence galaxies at z ∼ 1.2 from V20a. Yellow and red lines indicate galaxies in our sample with fAGN ≤ 20% and > 20%, respectively. Open blue circles show Chandra detections at 2−10 keV.
Current usage metrics show cumulative count of Article Views (full-text article views including HTML views, PDF and ePub downloads, according to the available data) and Abstracts Views on Vision4Press platform.
Data correspond to usage on the plateform after 2015. The current usage metrics is available 48-96 hours after online publication and is updated daily on week days.
Initial download of the metrics may take a while.