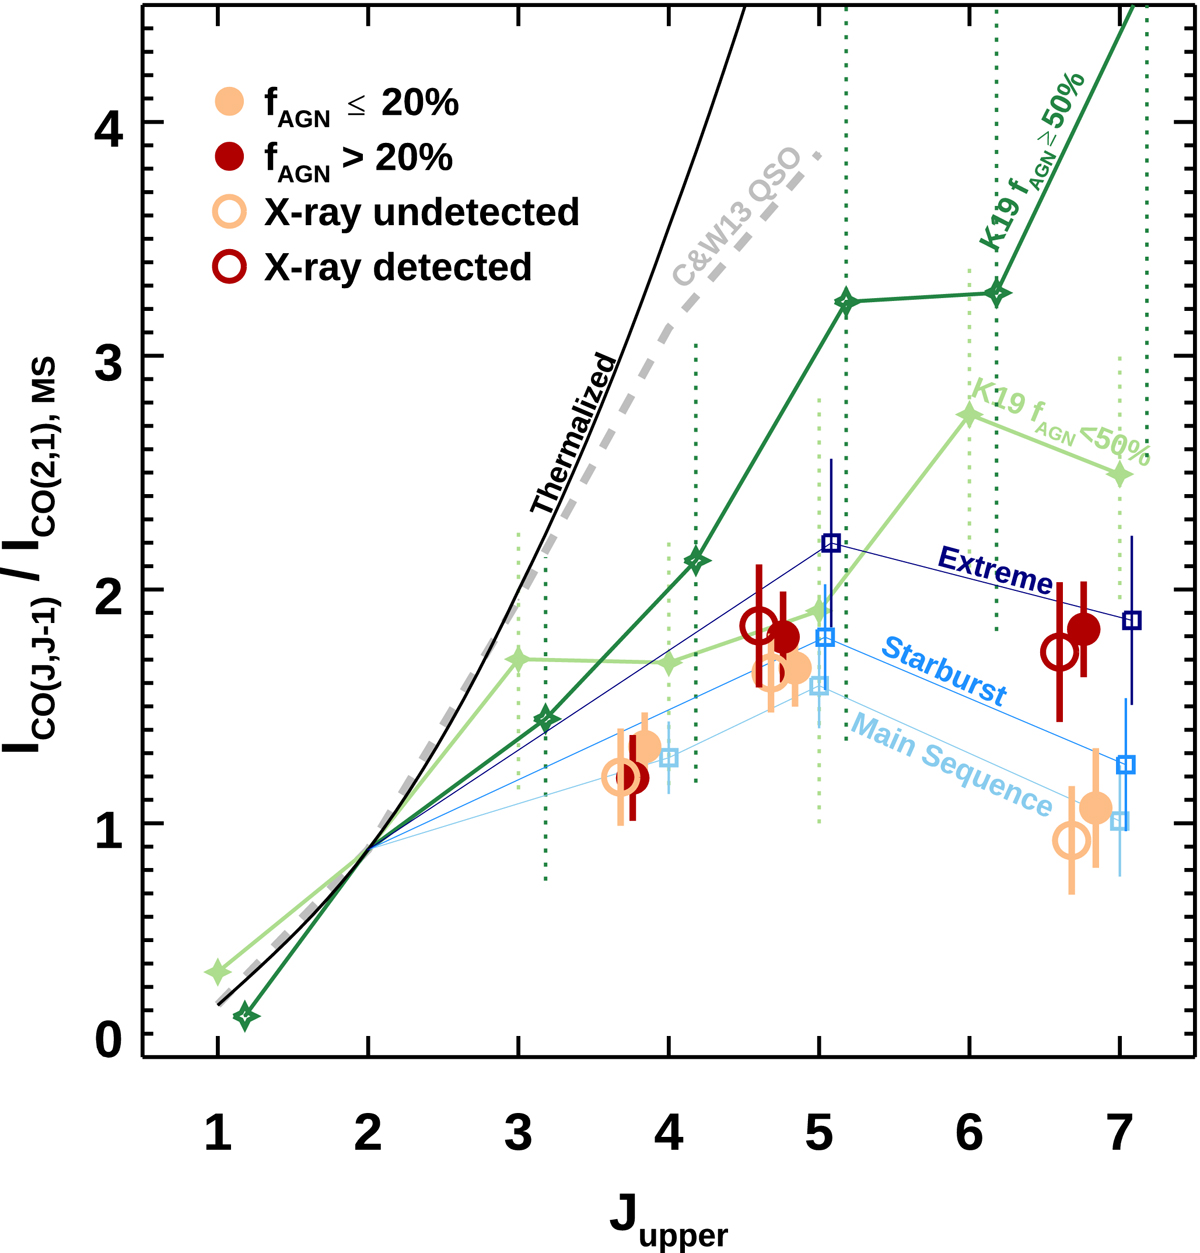
Fig. 5.
Download original image
Average CO spectral line distributions of AGN hosts and star-forming galaxies as well as average SLEDs for AGN hosts and star-forming galaxies normalized to the average CO (2 − 1) flux of main-sequence galaxies at z ∼ 1.2 from V20a. Filled yellow and red circles indicate galaxies in our sample with fAGN ≤ 20% and > 20%, respectively. Open yellow and red circles show objects split according to their Chandra detection at 2−10 keV. Blue open squares represent the SLEDs of the main sequence and (extreme) starbursts (> 7×) > 3.5× above the main sequence from V20a. Filled light and empty dark green stars show the average SLEDs from the stacking in Kirkpatrick et al. (2019), splitting AGN hosts and star-forming at fAGN, mid-IR = 50% (comparable with our fAGN = 20% threshold; see their Eq. (1)). The dashed gray line marks the QSO SLED in Carilli & Walter (2013). The L′ luminosity values for our samples are reported in Table B.1. We note that the statistics of X-ray detections of AGN with measurements of CO (4 − 3) are not sufficient to derive an average estimate.
Current usage metrics show cumulative count of Article Views (full-text article views including HTML views, PDF and ePub downloads, according to the available data) and Abstracts Views on Vision4Press platform.
Data correspond to usage on the plateform after 2015. The current usage metrics is available 48-96 hours after online publication and is updated daily on week days.
Initial download of the metrics may take a while.