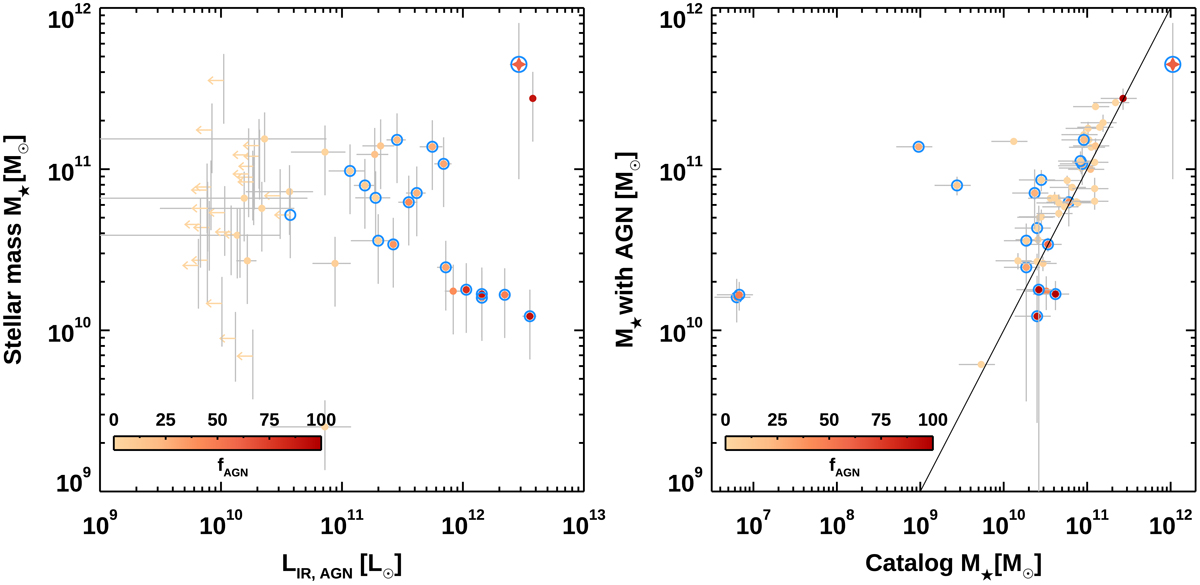
Fig. B.2.
Download original image
Detectability of AGN signatures at different stellar masses. Left: stellar mass as a function of the IR luminosity attributed to the AGN emission LIR, AGN. The symbols represent our sample at z ∼ 1.2 and are color coded according to fAGN as in previous figures. Empty blue circles indicate X-ray detections. Arrows mark the floor of fAGN = 1% adopted in this work. A similar picture is offered when using L2 − 10 keV as a proxy for the AGN emission in lieu of LIR, AGN. Right: stellar masses from the standard stellar population synthesis modeling (Muzzin et al. 2013; Laigle et al. 2016) compared with results obtained by following Circosta et al. (2018). Symbols and colors are the same as in the left panel.
Current usage metrics show cumulative count of Article Views (full-text article views including HTML views, PDF and ePub downloads, according to the available data) and Abstracts Views on Vision4Press platform.
Data correspond to usage on the plateform after 2015. The current usage metrics is available 48-96 hours after online publication and is updated daily on week days.
Initial download of the metrics may take a while.