| Issue |
A&A
Volume 643, November 2020
|
|
|---|---|---|
| Article Number | A127 | |
| Number of page(s) | 22 | |
| Section | Extragalactic astronomy | |
| DOI | https://doi.org/10.1051/0004-6361/201936961 | |
| Published online | 13 November 2020 | |
Searching for molecular gas inflows and outflows in the nuclear regions of five Seyfert galaxies⋆
1
Observatorio Astronómico National (OAN), Alfonso XII 3, 28014 Madrid, Spain
2
Departamento de Física de la Tierra y Astrofísica and IPARCOS-UCM (Instituto de Física de Partículas y del Cosmos de la UCM), Facultad de Ciencias Físicas, Universidad Complutense de Madrid, 28040 Madrid, Spain
e-mail: ajdfernandez@ucm.es
3
Centro de Astrobiología (CAB, CSIC-INTA), ESAC Campus, 28692, Villanueva de la Cañada, Madrid, Spain
4
Max Planck Institut für extraterrestrische Physik Postfach 1312, 85741 Garching bei München, Germany
5
Space Telescope Science Institute, Baltimore, MD 21218, USA
6
Department of Physics, University of Oxford, Keble Road, Oxford OX1 3RH, UK
7
Centro de Astrobiología (CSIC-INTA), Ctra. de Ajalvir, Km 4, 28850 Torreján de Ardoz, Madrid, Spain
8
National Astronomical Observatory of Japan, National Institutes of Natural Sciences (NINS), 2-21-1 Osawa, Mitaka, Tokyo 181-8588, Japan
9
Department of Astronomical Science, SOKENDAI (The Graduate University of Advanced Studies), 2-21-1 Osawa, Mitaka, Tokyo 181-8588, Japan
10
Instituto de Astrofísica de Canarias, Calle Vía Láctea, s/n, 38205 La Laguna, Tenerife, Spain
11
Departamento de Astrofísica, Universidad de La Laguna, 38206 La Laguna, Tenerife, Spain
Received:
21
October
2019
Accepted:
2
March
2020
Active galactic nucleus (AGN) driven outflows are believed to play an important role in regulating the growth of galaxies, mostly via negative feedback. However, their effects on their hosts are far from clear, especially for low- and moderate-luminosity Seyferts. To investigate this issue, we obtained cold molecular gas observations, traced by the CO(2-1) transition, using the NOEMA interferometer of five nearby (distances between 19 and 58 Mpc) Seyfert galaxies. The resolution of ∼0.3–0.8 (∼30–100 pc) and field of view of NOEMA allowed us to study the CO(2-1) morphology and kinematics in the nuclear regions (∼100 pc) and up to radial distances of ∼900 pc. We detected CO(2-1) emission in all five galaxies with disky or circumnuclear ring-like morphologies. We derived cold molecular gas masses on nuclear (∼100 pc) and circumnuclear (∼650 pc) scales in the range from 106 to 107 M⊙ and from 107 to 108 M⊙, respectively. In all of our galaxies, the bulk of this gas is rotating in the plane of the galaxy. However, noncircular motions are also present. In NGC 4253, NGC 4388, and NGC 7465, we can ascribe the streaming motions to the presence of a large-scale bar. In Mrk 1066 and NGC 4388, the noncircular motions in the nuclear regions are explained as outflowing material due to the interaction of the AGN wind with molecular gas in the galaxy disk. We conclude that for an unambiguous and precise interpretation of the kinematics of the cold molecular gas, we need detailed knowledge of the host galaxy (i.e., presence of bars, interactions, etc.), and also of the ionized gas kinematics and ionization cone geometry.
Key words: galaxies: general / galaxies: kinematics and dynamics / galaxies: Seyfert / galaxies: active
The reduced datacubes are only available at the CDS via anonymous ftp to cdsarc.u-strasbg.fr (130.79.128.5) or via http://cdsarc.u-strasbg.fr/viz-bin/cat/J/A+A/643/A127
© ESO 2020
1. Introduction
The molecular gas is the main phase of the interstellar medium (ISM) in the central regions of galaxies (Schneider 2007) and is the material from which new stars are formed. In active galaxies, meaning those harboring an accreting supermassive black hole (SMBH), it also plays a role in feeding the central engine. At the same time, the molecular gas in the galaxy disks may be affected by active galactic nucleus (AGN) activity via feedback (positive or negative, see Fiore et al. 2017, and references therein). Understanding the balance between feeding and feedback processes and how it changes through cosmic time is crucial to understanding how galaxies and their SMBH coevolve.
Seyfert galaxies and low-luminosity AGN have large amounts of molecular gas in their nuclear and circumnuclear regions with morphologies resembling nuclear disks, rings, and mini spirals (e.g., Schinnerer et al. 2000a,b; García-Burillo et al. 2003; Krips et al. 2007; Davies et al. 2014; Sani et al. 2012; Combes et al. 2019; Alonso-Herrero et al. 2018, 2019). These morphologies might be related to the mechanisms transporting gas from kiloparsec scales all the way down to the SMBH sphere of influence. On nuclear and circumnuclear scales, the molecular gas has been observed inflowing and outflowing, depending on the galaxy (García-Burillo & Combes 2012; Combes et al. 2013, 2014; Davies et al. 2014; García-Burillo et al. 2014, Gallimore et al. 2016). Still, it is unclear how the gas loses almost all its angular momentum on its way to the accretion disk on sub-pc scales (Lynden-Bell & Pringle 1974; Pringle 1981; García-Burillo et al. 2005; Haan et al. 2009).
Molecular outflows on scales from tens to some hundreds of parsecs are predicted by some recent torus models in the context of the gas cycle of AGN, such as radiation-driven torus models (Wada 2012; Hönig & Kishimoto 2017; Williamson et al. 2019; Izumi et al. 2018). Indeed, these nuclear molecular outflows taking place in the nuclear torus/disk and on circumnuclear scales have already been detected in a few nearby Seyfert galaxies (Combes et al. 2013; Morganti et al. 2015; Gallimore et al. 2016; Alonso-Herrero et al. 2018, 2019; García-Burillo et al. 2019). On hundreds of parsecs and kiloparsec scales in Seyfert galaxies, at a given AGN luminosity the outflow molecular phase shows maximum velocities below those of the ionized phase (Fiore et al. 2017). This suggests that the AGN wind in this type of active galaxies generally has only a moderate impact on the ISM of their host galaxies. When these molecular outflows can be spatially resolved, the AGN wind is generally found to sweep rather than clear out the cold molecular gas completely (García-Burillo et al. 2014; Morganti et al. 2015; Alonso-Herrero et al. 2018, 2019).
In this context, we started several programs to obtain sub-arcsecond resolution observations of the cold molecular gas in Seyfert galaxies. One of our goals is to study the gas cycle (inflows/outflows) in the nuclear (scales of tens of parsecs) and circumnuclear regions (scales of a few hundred parsecs) of active galaxies. We chose nearby galaxies (z ≲ 0.01) so we can achieve this physical resolution. We have used both the NOrthern Extended Millimeter Array (NOEMA) in the northern hemisphere and the Atacama Large Millimeter Array (ALMA) in the southern hemisphere. We selected our samples of Seyfert galaxies covering a range AGN luminosities, nuclear obscurations, and nuclear mid-infrared emission properties including the detection of polycyclic aromatic carbon (PAH) emission (Hönig et al. 2010; Alonso-Herrero et al. 2014, 2016). Another criterion for selecting Seyfert galaxies for our study was the availability of observations and the corresponding modeling of the ionized gas and stellar continuum emission, preferably taken with integral field units (IFU). These observations probe the AGN wind kinematics as well as the ionization cone geometry, and the host galaxy kinematics, respectively. As we see throughout this work, these observations are crucial to interpreting the kinematics of the molecular gas.
In this paper, we present NOEMA observations of the 12CO(J= 2-1) transition at νrest = 230.54 GHz of five northern Seyfert galaxies at distances between 19 and 58 Mpc (assuming ΛCDM cosmology with H0 = 73 km s−1 Mpc−1, ΩΛ = 0.73 and ΩM = 0.27). In Table 1, we summarize main properties of the sample including the morphological types and the X-ray 2 − 10 keV intrinsic luminosities, meaning corrected for absorption. Table 2 lists the position angles (PA) of the main bar and the ionization cone as well as the PA and inclination of the host galaxy disk for all of our sources. With the NOEMA observations we aim to study the properties and kinematics of the cold molecular gas in the nuclear (typically less than 100 pc resolutions) and circumnuclear regions (typically the central ∼600 pc).
General properties of the galaxies in our sample.
Main bars, [OIII]λ5007 emission, and stellar disk inclination.
This paper is organized as follows. In Sect. 2, we present our observations and describe the data reduction. In Sect. 3, we briefly discuss the data analysis. In Sect. 4, we present the results source by source, and in Sect. 5, the molecular gas masses. In Sect. 6, we discuss the main results of the paper. Finally, we summarize our conclusions in Sect. 7.
2. Observations and data reduction
In this section we present the observations used in this work.
2.1. NOEMA observations
We obtained NOEMA observations of the CO(2-1) transition (νrest = 230.54 GHz) and its underlying continuum (∼1.3 mm) between March 2015 and December 2016 in the A configuration, except for one track of NGC 2273 that was observed with the B configuration. Due to the expansion of NOEMA, our observations were taken with a different number of antennas ranging from six to eight (see Table 3). Two galaxies (Mrk 1066 and NGC 2273) were observed with two different configurations (see Table 3), which were combined to produce the final data cubes. The bandpass, flux, phase, and amplitude calibrations were done using standard calibrators of the NOEMA archive, observed at the beginning and/or at the end of the tracks. The full width at half maximum (FWHM) of the Gaussian primary beam of NOEMA at the CO(2-1) transition frequency for our local sources is ∼22″, which can be considered as the diameter of the NOEMA field of view (FoV). The final data cubes were split into 360 channels, each of ∼13 km s−1 width, to improve the signal-to-noise ratio (S/N).
Log of NOEMA observations and data reduction.
We performed the data reduction using the Grenoble Image and Line Data Analysis Software (GILDAS1) with standard techniques. We used natural weight to clean all data cubes to obtain the best sensitivity. We employed the task UV_AVERAGE to produce the continuum images, which are the average of the line-free emission channels. Then, we subtracted the continuum from the original cubes to obtain the line-emission data cubes. In order to optimize the result of the deconvolution process, we used polygons that enclosed the emission above 3σ during the cleaning of both the continuum images and line-emission data cubes. The synthesized beam sizes and their PA are listed in Table 3 for each galaxy. The final resolutions are in the range 0.4″–0.7″. At the distances of our galaxies, they correspond to physical sizes in the range 65–115 pc.
All but one (NGC 4388) of the maps presented here were not corrected by primary beam attenuation. In the case of NGC 4388, the observed CO(2-1) emission is spread over the full NOEMA FoV. As the attenuation of the emission is expected to be greater as we move away from the phase center, we applied the primary beam correction to correct for this.
2.2. Ancillary data
We downloaded fully reduced Hubble Space Telescope (HST) images from the Hubble Legacy Archive (HLA) and Mikulski Archive for Space Telescopes (MAST) archives in the WFPC2 F606W (∼ broad-band V) and NICMOS F160W (∼ broad-band H) filters to produce V − H color maps. For NGC 4388, the best quality WFPC2 F606W image has a low S/N to the northwest (NW) of the nucleus, and thus we used the WFC3/UVIS F814W (∼ broad-band I) image for the optical emission instead. As we show, these color maps trace the dust extinction in the galaxies and can be compared directly with the cold molecular gas emission.
3. Analysis of the NOEMA observations
In this section we fit the NOEMA continuum emission, produce the CO(2-1) moment maps, model the kinematics and discuss the characterization of the noncircular motions in our sample of galaxies.
3.1. Fit of the continuum emission
We first determined the location of the 1.3 mm continuum sources by fitting a point source model, and when needed, circular or elliptical Gaussians to account for any extended emission. We performed these fits in the uv-plane using the GILDAS task UV_FIT. When we fit the extended emission, we also derived the source deconvolved size. We identified the 1.3 mm continuum peak as the AGN position, except for NGC 4388. For this galaxy, whose continuum at 1.3 mm has not been detected, we used the position of 21 cm continuum peak from Very Long Baseline Radio Interferometry (VLBI) observations as the location of the nucleus (Giroletti & Panessa 2009, see further discussion in Sect. 4.4). In Table 4, we summarize the results of the continuum fits, and in Sect. 6 we describe in detail the results for each galaxy.
Continuum best-fit parameters.
3.2. CO(2-1) moment 0 maps
We first produced maps of the integrated CO(2-1) emission using the MOMENTS task in GILDAS. To do that, we applied a clipping of 3σ in each pixel of every velocity channel with significant line emission (≳3σ) of the continuum-free line cube and integrated over them. We calculated the rms noise in a channel (σch) by running the task GO NOISE over a wide range of channels (∼50) without line emission, and then we propagated it with the formula  , where N is the number of channels with line emission, and δv is the width of the channel (∼13 km s−1 in our case), to obtain the noise in the integrated intensity maps.
3.3. CO(2-1) moments 1 and 2 and kinematic modeling
To model the CO(2-1) cold molecular gas kinematics and to look for noncircular motions, we used 3DBAROLO (Di Teodoro & Fraternali 2015). 3DBAROLO fits a tilted-ring model to 3D (2 spatial × 1 spectral) data cubes. We followed an analogous procedure like the one described by Alonso-Herrero et al. (2018), which we summarize here briefly. In the first run, we allowed five parameters to vary: systemic and rotation velocities, velocity dispersion, as well as the disk inclination (i) and disk PA. We fixed the kinematic center to the coordinates measured from the peak of the 1.3 mm continuum or that of the 21 cm continuum in the case of NGC 4388, which are assumed to identify the AGN location. We also assumed a thin disk with a scale height of 100 pc (Iorio et al. 2016). We computed the fits by minimizing the absolute value of the subtraction of the observed velocity field from model and using uniform weighting. For the second run, we fixed systemic velocity, disk i, and disk PA to the average values derived in the first run, and we reran 3DBAROLO only allowing the rotation velocity and velocity dispersion to vary. This way, we produced a simple rotating model, which we then subtracted from the observed mean velocity field to look for deviations from circular motions.
The main outputs of 3DBAROLO used in this work are the observed mean velocity field (1st-order moment), the observed velocity dispersion (2nd-order moment) and the velocity model maps. We decided to extract the first and second moments with 3DBAROLO for consistency, that is, to compare all kinematic maps (mainly the first moment and its model) extracted in the same way. Finally, we obtained the mean velocity residuals maps by subtracting the models from the observed velocity fields.
In Table 5, we list the average values of the disk model parameters derived with 3DBAROLO. The i and PA derived from the CO(2-1) kinematics are in good agreement with those derived at other wavelengths in all galaxies (Table 1), except in two cases (NGC 4253 and NGC 7465), which are discussed in their corresponding sections (see Sects. 4.3 and 4.5).
Average parameters of the 3DBAROLO rotating disk model.
The models produced this way rely on the assumption that the majority of the cold molecular gas resides in an infinitely thin axisymmetric disk orbiting in pure circular orbits. To validate this assumption, we fit the velocities derived in each ring along the major axis with 3DBAROLO to a parametric rotational curve (e.g., Salak et al. 2016; Barbosa et al. 2009) given by the following expression:
where vobs is the observed velocity, vsys is the systemic velocity, R is the radius of the ring considered in the plane of the sky, G is the gravitational constant, M is the mass enclosed inside the A scale length, and i is the inclination of the galaxy. In this case, the only free parameters were M and A, and we used the curve_fit function, which is part of the SciPy library, to do the fit. The resulting rotational curves are depicted in the position-velocity diagrams along the major axis for each galaxy.
3.4. Characterization of the noncircular motions
To make an appropriate interpretation of the CO(2-1) velocity residuals and additional kinematic components, it is essential to know the host galaxy PA and inclination, the geometry of ionization cones, or at least their projected sizes and orientations, as well as the orientations of the stellar bars.
As discussed in the Introduction, our Seyfert galaxies have optical and/or near-infrared (NIR) IFU observations from the literature and there are good estimates of the PA and inclination of the host galaxy disks (see Table 2 for the values and references). For the AGN ionization cones, we used the information available in the literature or our own estimations from [OIII]λ5007 images and/or [OIII]λ5007/Hα+[NII] excitation maps (see Table 2). We note that the [OIII] line has a relatively high ionization potential (35.12 eV), and for that reason is suitable to trace the ionization bicone (e.g., Chen et al. 2019). The excitation maps help distinguish between emission coming from an AGN and star formation (e.g., Ferruit et al. 2000). For each galaxy, we plotted the axis and edges of the ionization cones as yellow dotted and green dashed lines, respectively.
Primary bars regulate the distribution and kinematics of cold gas that resides in the galaxy plane not only on kpc-scales, where the gas tends to follow the so-called x1 orbits, but also on scales as small as hundreds of parsecs from the nucleus, where x2 orbits usually dominate. In Table 2, we list the PA (plotted for each galaxy with a brown solid line in its corresponding figure), and radius of the primary bar (and the literature references). Since we are studying the gas motions in the galaxy plane, a key factor is to know whether the region of interest is inside or outside the corotation region of the bar (e.g., García-Burillo et al. 1994). A rough prediction of the corotation radius2 (RCR) of the main bar can be obtained from the empirical ratio RCR/Rbar ∼ 1.2 ± 0.2 found by Athanassoula (1992), which is in fairly good agreement with recent calculations (e.g., Aguerri et al. 2015). Given the values of Rbar for the bars in our sample (see Table 2), this criterion places the regions proved by our NOEMA observations well inside the corotation region of each respective main bar. Some of the galaxies in our sample also show evidence of a nuclear/secondary bar. This kind of bar is believed to help gas not to get trapped in the inner Lindblad resonance (ILR) of the main bar, favoring the inflow motions in the innermost regions of the galaxy (Shlosman et al. 1989). It is less straightforward to obtain an estimation of its corotation radius, as this requires high angular-resolution data. Thus, we discuss this issue in the corresponding section of the galaxies where the existence of such bars has been proposed (Mrk 1066 and NGC 4253).
By definition, the mean velocity field (first moment) gives flux-density-weighted velocities. Thus, the mean velocity of each spaxel (or spectral pixel) is biased towards the brighter velocity components of its spectrum. Consequently, the modeled and residual velocities are also biased. Thus, analyzing only the mean velocity residual map may lead to misinterpreting the motions of the gas. To overcome this issue, we extracted spectra from regions that show either peculiar velocity residuals or/and high velocity dispersion (always > 13 km s−1, i.e., our spectral resolution) to search for additional kinematic components that cannot be explained by circular rotation. We expect that if the bulk motion of the gas is rotating in the plane of the galaxy, the brighter component of the extracted spectrum has a centroid close to the modeled velocity. Other velocity components reveal departures from that motion and are related to local gas flows.
We preferentially looked for noncircular motions along the derived kinematic minor axis of the galaxy or its surroundings because the rotational component of the galaxy is zero, and so any nonzero kinematics are due to radial motions. Thus, we produced position-velocity diagrams along the derived kinematic minor axis as an additional tool to reveal noncircular motions. We also produced position-velocity diagrams along the derived kinematic major axis to study the gas rotation. The position-velocity diagrams were constructed with 3DBAROLO using the default slit width given by the tool, that is, a single pixel, which ranges from 7.1 × 10⁻² to 7.6 × 10⁻² arcsec in the case of our galaxies.
In the absence of noncircular motions, the position-velocity diagrams along the minor axis are expected to show emission around the systemic velocity with a typical width of a few tens of km s−1 due to the combined effect of the intrinsic cloud-cloud velocity dispersion and the beam smearing (e.g., García-Burillo et al. 2014). However, the effect of the beam smearing is known to be more important in the central regions, where the velocity gradient is steeper (e.g., Davies et al. 2011; Tacconi et al. 2013; Federrath et al. 2017). For this reason, we only considered departures from circular rotation in these regions truly as signatures of noncircular motions if we can confirm them with extracted spectra, or if they are > 100 km s−1 and have a clear positive/negative pattern in opposite sides of the galaxy. The latter value has been chosen because it is twice the expected dispersion velocity for a pure rotating disk (García-Burillo et al. 2014).
Finally, for a correct interpretation of the noncircular motions, we need to know where the cold molecular gas is. Streaming motions due to spiral arms or bars are naturally associated with the plane of the galaxy. This may not necessarily be the case for outflows. In the best-studied case of a molecular outflow in a Seyfert galaxy, NGC 1068, there is clear evidence of a three-dimensional morphology (a component in the plane of the galaxy plus a vertical component). However, in this Seyfert, the bulk of the outflowing molecular gas is in the galaxy disk (see García-Burillo et al. 2014, 2019, for more details). Thus, based on the observational evidence (see also the Introduction), it is reasonable to assume that the cold molecular outflows in the nuclear regions of low- and moderate-luminosity Seyferts take place in the plane of the galaxy.
4. Results for individual galaxies
In the following subsections we describe in detail the CO(2-1) morphology and kinematics for the individual galaxies in our sample.
4.1. Mrk 1066 (UGC 02456)
This double-barred galaxy harbors a Seyfert 2 nucleus (Goodrich & Osterbrock 1983) and is classified as a Compton-thick candidate (Levenson et al. 2001; Hernández-García et al. 2015). The primary bar is oriented at a PA∼ 143° (see Fig. 1) and has a diameter of 31" (∼7.0 kpc) (Mazzarella & Boroson 1993; Afanasiev et al. 1998). In addition, it may have a nuclear bar oriented at PA = 112° with a radius of 2.5″ (∼0.6 kpc) according to the works of Afanasiev et al. (1998) and Riffel et al. (2017). Mrk 1066 shows signs of a recent minor merger (Gimeno et al. 2004; Smirnova et al. 2010). Bower et al. (1995) reported a jet-like structure extending ∼1 4 to the NW of the nucleus at PA = 315° based on their HST [OIII]λ5007 image. The radio emission at 3.6, 6 and 21 cm shows a similar morphology (Ulvestad & Wilson 1989; Nagar et al. 1999).
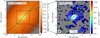 |
Fig. 1. Mrk 1066. Left: HST/WFPC2 F606W (∼ V band) image. Right: NOEMA CO(2-1) integrated intensity map (0th moment) with a 3σ clipping applied on each pixel for the channels with line emission in the continuum-free line cube (see Sect. 3). Masked pixels are shown in grey. The green dashed lines represent the edges of the ionization cone, and the dashed yellow line the cone axis. The brown solid lines are the PA of the major axis of the main bars. The parameters and references for both the bicone and the main bar are listed in Table 2. In both figures, north is up and east to the left. The hatched ellipse in the bottom-left corner of the right panel is the beam size (see Table 3). The CO(2-1) integrated intensity contours are as follows: 0.5 (∼4σ, σ = 0.13 Jy km s−1 beam−1) and from 1 to 12 Jy km s−1 beam−1, in steps of 1.0 Jy km s−1 beam−1. |
4.1.1. Morphology
The 1.3 mm continuum image (Fig. 2d) shows a bright source detected at a 18σ level. There are also weak elongations along PA ∼ 300° and PA ∼ 350°. However, it can be successfully fit in the uv-plane with an elliptical Gaussian function of size  and PA = 120° (see Table 4). The continuum source is thus oriented approximately along the major axis of the galaxy. The coordinates of the 1.3 mm continuum peak are coincident (within the errors) with those of the 3.6 and 20 cm continuum peaks (Nagar et al. 1999).
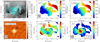 |
Fig. 2. Mrk 1066. Panel a: CO(2-1) integrated intensity contours (as in Fig. 1) in blue overlaid on the V − H color map. Light colors indicate low extinction and dark colors high extinction. Panel b: 3DBAROLO CO(2-1) observed velocity field. Panel c: 3DBAROLO velocity model. Velocity contours in b and c panels are from 3540 to 3800 km s−1 in steps of 20 km s−1. Panel d: 1.3 mm continuum map with the contours at −6σ, −3σ (white dashed line), 3σ, 6σ, 9σ, 12σ, 15σ, and 18σ (white solid line), and σ = 41 μJy beam−1. Panel e: residual velocity map. Contours are from −50 to 50 km s−1 in steps of 10 km s−1. Purple stars and ellipses mark the regions from which we extracted spectra (see Fig. 3). Panel f: 3DBAROLO CO(2-1)-observed velocity dispersion map. Contours are in steps of 10 km s−1, starting at 10 km s−1. Ellipses in the bottom corners are the NOEMA-synthesized beam (see Table 3), and the red or black dashed (dotted) line is the major (minor) kinematic axis derived from the 3DBAROLO fit (see Table 5). The white star marks the 1.3 mm continuum peak. |
Most of the NOEMA cold molecular gas emission (right panel of Fig. 1) in Mrk 1066 is concentrated within the nuclear region at r < 2″ (≲450 pc) with a disk-like morphology, as observed at other wavelengths including the ionized-gas (Riffel & Storchi-Bergmann 2011) and the 8.7 μm emission (Alonso-Herrero et al. 2014; Ramos Almeida et al. 2014). There is also a spiral arm segment approximately 1″ to the NW of the nucleus and more diffuse emission far away to the NW, and clouds to the southwest (SW) and southeast (SE) of the AGN within the inner 4″ (∼0.9 kpc). The CO(2-1) emission peaks at the location of the AGN as traced with the 1.3 mm continuum peak. In the central region, the CO(2-1) emission shows a two-arm mini-spiral morphology starting from the edges of the disk-like structure, which is also seen in the V − H color map (see Fig. 2, panel a, and also Martini et al. 2003). The nuclear spiral morphology was also reported by Riffel & Storchi-Bergmann (2011). The concave sides of the arms show strong reddening, suggesting that the spiral trails. Finally, the more prominent dust lanes are in the SW, indicating that this is the near side of the galaxy. The [OIII] emission is more prominent to the NW, suggesting that the SE side of the cone is obscured by the disk (Bower et al. 1995; Fischer et al. 2013).
4.1.2. CO(2-1) Kinematics
The CO(2-1) observed mean velocity field of the inner region of Mrk 1066 derived with 3DBAROLO is shown in Fig. 2b. The general pattern of the isovelocities corresponds undoubtedly to rotation in the plane of the galaxy. This is similar to results for the warm molecular gas traced by the NIR H2 2.12 μm emission line (Riffel & Storchi-Bergmann 2011). The central isovelocities present a characteristic S-shape, which is associated with oval structures. A similar feature is also present in the stellar velocity field (Riffel & Storchi-Bergmann 2011). The velocity dispersion map (Fig. 2f) presents the highest values (> 30 km s−1) close to the nucleus, and displays an oval shape elongated along PA ∼ 32°. Starting from the central oval, there are two finger-like structures that trace, approximately, the spiral arms seen in the HST V − H map.
The 3DBAROLO velocity model of Mrk 1066 (panel c of Fig. 2, parameters of the model are listed in Table 5) fits the observed velocity field reasonably well. However, it does not reproduce the S-shape isovelocities and the higher velocities in the spiral arm segment. The CO(2-1) disk i and PA of the model are close to those obtained from the stellar component and warm molecular gas but not the systemic velocity, which is ∼50 km s−1 higher than that derived from the stellar component (Riffel & Storchi-Bergmann 2011; Riffel et al. 2017). For comparison, the systemic velocity obtained for the HI component is 3610 km s−1 (Mirabel & Wilson 1984), meaning approximately in the middle of the molecular and stellar values. Furthermore, our value for the systemic velocity is close to that obtained for the strongest maser component reported by Henkel et al. (2005).
As can be seen from Fig. 2 (panel e), the amplitude of the residuals is ≤40 km s−1 ( [(vobs − vmodel)/sin(i)] ≤ 52 km s−1 deprojected). This small amplitude means that our model reproduces the bulk of the gas motions. Thus, we can conclude that the majority of the cold molecular gas traced by the CO(2-1) emission is rotating in the plane of the galaxy (see also Riffel & Storchi-Bergmann 2011). Apart from the deviations seen at the edge of the modeled FoV (likely artifacts due to the low S/N there), there are two regions ∼0 5 northeast (NE) and SW from the AGN (marked with hatched circles in panel e of Fig. 2) and along the kinematic minor axis with significant residuals. We extracted beam aperture CO(2-1) spectra and found that both show two velocity components (see Fig. 3). In both spectra, the centroid of one of the peaks is close to the velocity predicted by the 3DBAROLO model, suggesting that this component corresponds to the rotating gas in the disk of the galaxy. The other centroid is redshifted by ∼90 km s−1 in the spectrum extracted to the NE of the AGN and blueshifted by ∼30 km s−1 in the spectrum extracted to the SW. The presence of these noncircular motions can also be clearly seen in the position-velocity diagram taken along the kinematic minor axis, whereas the rotation pattern is well reproduced with the 3DBAROLO model along the kinematic major axis (Fig. 4).
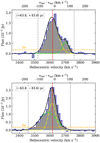 |
Fig. 3. CO(2-1) spectra from the two nuclear regions of Mrk 1066 integrated over an area equal to the beam. The Gaussians we fit to identify the different kinematic components are the color dash-dotted lines and their sum the black line. The horizontal orange dashed line is the 5σ level, where σ is the standard deviation in the channels outside of the spectral window (vertical gray dashed lines). We also show the modeled velocity (vertical red dashed line) for the rotating disk obtained with 3DBAROLO for the central pixel of the area (purple stars in Fig. 2, panel e). Relative coordinates in pc from the AGN for the central pixel of the apertures are given in the top left boxes. |
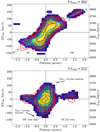 |
Fig. 4. Position-velocity diagrams taken along the kinematic major (PA∼302°) and minor (PA∼212°) axes of Mrk 1066 extracted with 3DBAROLO. Color images and the blue contours 1 (3σ, see Table 3), 2, 4, 8, and 16 times 5.1 × 10−3 Jy beam−1 represent the observed CO(2-1) line emission. Red contours depict the 3DBAROLO rotating disk model and their values are the same as the blue ones. Magenta stars represent the velocities in each ring of the model, while the cyan dashed line is the best fit of these velocities to the parametric rotational curve given by Eq. (1). The black dotted lines (bottom panel) enclose the emission that shows noncircular motions approximately. |
The amplitude of the noncircular velocity values of the cold molecular gas, observed along the minor axis, are similar to those measured in the nuclear/circumnuclear regions of other Seyfert galaxies (see e.g., Alonso-Herrero et al. 2018). Assuming that the corotation radius of the nuclear bar is similar to its radius (∼2 5), then the noncircular motions are taking place within the corotation region of the nuclear bar. Then, if the noncircular motions are taking place in the disk of the galaxy, given its orientation, they are due to outflowing molecular gas.
In Fig. 1, we overlaid the approximate orientation and projected size of the ionization bicone of Mrk 1066 modeled by Fischer et al. (2013). The bicone orientation (the angle between the plane of the sky and the end of the NW cone is iNW cone ∼ 10°) and opening angle (α = 15 − 25°) would imply that the AGN wind does not intersect the galaxy disk (neither with their assumed inclination of the galaxy disk (i = 54°) nor with ours). Similarly, Riffel & Storchi-Bergmann (2011) assumed that the bicone axis is close to the plane of the sky (iNW cone ≳ 0°) and that the projected opening angle is ∼20 to interpret their observations. However, there is still room for an AGN wind-driven outflow if the base of the ionization cone crosses at least a small fraction of the galaxy disk. In this case, the AGN wind would be pushing the molecular gas radially outwards in the galaxy disk on scales of less than 100 pc along the minor axis of the galaxy. This is similar to recent results found for the Seyfert galaxy NGC 3227 (Alonso-Herrero et al. 2019).
4.2. NGC 2273 (Mrk 620)
This Seyfert 2 galaxy (Contini et al. 1998) has a set of nested rings (Van Driel & Buta 1991). Its main bar has a radius of 27" and is oriented at PA = 108° (Moiseev et al. 2004, see Fig. 5, left panel). The inner ring (r ∼ 2″) is suspected to coincide with the ILR of the main bar (Erwin & Sparke 2002, 2003). At optical wavelengths, Ferruit et al. (2000) concluded that the regions ∼1″.5 to the north and south of the nucleus are likely star forming regions, based on the low values in their [OIII]λ5007/Hα+[NII] excitation map. NGC 2273 is classified as Compton-thick in X-rays (NH ≥ 1024 cm−2, Comastri 2004; Awaki et al. 2009).
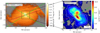 |
Fig. 5. Same as Fig. 1 but for NGC 2273. CO(2-1) integrated-intensity contours: 0.5 (5σ, σ = 0.1 Jy km s−1 beam−1) and from 1.5 to 9 Jy km s−1 beam−1, in steps of 1.5 Jy km s−1 beam−1. |
4.2.1. Morphology
The 1.3 mm continuum, shown in Fig. 6d, presents four distinct components. We associated the brightest with the AGN position. This choice also maximized the spatial correspondence between the CO(2-1), dust, and Hα morphologies (compare Fig. 6a with the top panel of Fig. 7 of Ferruit et al. 2000). Moreover, the coordinates of 1.3 mm continuum peak (Table 4) are in good agreement with those derived from the 33 GHz (9.1 mm) continuum (Kamali et al. 2017). The western components of the 1.3 mm continuum (termed W1 and W2 in Table 4) roughly agree with the extended radio component found in 3.6 and 20 cm observations (Nagar et al. 1999; Mundell et al. 2009). These components are aligned with the highly ionized gas, which shows a jet-like structure extending ∼2″ from the nucleus in the east. Finally, the north component (termed N in Table 4) has no correspondence in either the 3.6 or 20 cm continuum images.
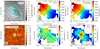 |
Fig. 6. Same as Fig. 2 but for NGC 2273. Velocity contours (b and c panels) are from 1645 to 2015 km s−1 in steps of 20 km s−1. The continuum contours are −3σ (white dashed line), 3σ, 6σ and 9σ (solid lines) with σ = 46 μJy beam−1. The residual velocity contours are from −50 to 50 km s−1 in steps of 10 km s−1. The velocity dispersion contours are in steps of 10 km s−1 starting at 10 km s−1. |
The CO(2-1) velocity-integrated intensity map (see Fig. 5) of NGC 2273 shows emission along the major axis of the galaxy at PA ∼ 54° and extending over approximately 6″ (0.7 kpc). In the innermost regions there are two bright CO(2-1) peaks that do not coincide with the AGN position but are located approximately 0 5 (∼60 pc) to the north and south of the AGN. These peaks are nearly perpendicular to the main stellar bar axis. Such features, often called “twin peaks” in the literature, were found in other galaxies (e.g., NGC 3351, NGC 6951) and might be caused by the confluence of the inward gas transported by the bar and the gas in roughly circular orbits inside the ILR of the bar (Kenney 1994; van der Laan et al. 2011). Petitpas & Wilson (2002) proposed the existence of a nuclear bar based on their CO(1-0) observations. The CO(2-1) emission shows a fairly similar morphology. The two peaks seen in CO(2-1) are spatially coincident with the two arms seen in the V − H color map (see Fig. 6a, and also Erwin & Sparke 2003). Then, if there is a nuclear bar, the peaks can be interpreted as molecular gas in the leading edges of this secondary bar. However, if this interpretation is correct, the motion of the gas inside the second bar will be trailing instead of leading, as suggested by Petitpas & Wilson (2002).
In the inner 4″ (∼0.5 kpc), there are other fainter CO(2-1) emitting regions, especially to the NE, where there is a star forming region seen in the Hα+[NII] map of Ferruit et al. (2000), and to the SW, coinciding with the end of the nuclear mini-spiral arms. A similar morphology is observed at 8.7 μm (Alonso-Herrero et al. 2014), again suggesting that the CO(2-1) emitting regions are (dusty) star forming regions. By contrast, Sani et al. (2012) found that the HCN(1-0) and HCO+(1-0) high-density gas tracers peak close to the 3 mm continuum. This probably indicates that the density and/or the excitation conditions of molecular gas are different between the AGN and its immediately surrounding regions ( ), where there might be some nuclear star formation activity (e.g., detection on nuclear PAH emission, see Alonso-Herrero et al. 2014, and next section).
The cold molecular gas is well correlated with the dust lanes traced by the V − H color map (see Fig. 6a). The majority of the dust is in the NW side, suggesting that it is the near side of the galaxy (see also Barbosa et al. 2009). As for Mrk 1066, the arms seem to trail according to the dust distribution, and, therefore, the gas motion is counterclockwise.
Excluding the emission to the NE, which is likely related to a star forming region, the [OIII] emission inside the inner ring is seen mainly to east of the nucleus (see Fig. 7 of Ferruit et al. 2000). This indicates that the approaching cone is projected on the eastern side, and the receding one is obscured by the galaxy disk (see Fig. 5).
4.2.2. Kinematics
The CO(2-1) observed mean velocity field of NGC 2273 is shown in Fig. 6b. The isovelocity pattern is quite similar to a spider diagram, suggesting that the deviations from pure rotation of the gas motion are quite small. Interestingly, the channel maps of HCN(1-0) and HCO+(1-0) of Sani et al. (2012, see their Fig. 11, upper panels) suggest that the molecular gas close to the nucleus has a velocity gradient almost opposite of those of the CO(2-1) and the stellar velocity fields (see below). As our spatial and spectral resolutions are better than those of Sani et al. (2012), the divergence does not come from the different resolutions. We hypothesize that they could have observed a warp in the galaxy disk in denser molecular gas tracers. The existence of such warp was suggested by Barbosa et al. (2006). However, we note that the misalignment between the PA of the major axis of CO(2-1) and stellar kinematics is significantly lower than that inferred from the H2O maser distribution (see Fig. 3 in Kuo et al. 2010).
The corresponding observed velocity-dispersion map (Fig. 6f) shows the highest values (∼50 km s−1) near the 1.3 mm continuum peak. Apart from that, it shows moderately high values towards the two peaks detected in the CO(2-1) integrated-intensity map.
The 3DBAROLO model reproduces the observed CO(2-1) velocity field well (panels b and c of Fig. 6), as well as the position-velocity diagrams along the kinematic major and minor axes (see Fig. 7). Our derived disk parameters (see Table 5) are in remarkably good agreement with those obtained from the stellar kinematics by Barbosa et al. (2006) and from HI gas by Van Driel & Buta (1991). They are also similar to those reported by Moiseev et al. (2004) from the NIR and optical surface brightness distributions. All this strongly suggests that the cold molecular gas follows the same kinematics as the stellar and neutral gas components.
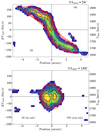 |
Fig. 7. Position-velocity diagrams taken along the kinematic major (PA ∼ 54°) and minor (PA ∼144°) axes of NGC 2273 extracted with 3DBAROLO. Contours are 1 (3σ, see Table 3), 2, 4, 8, and 16 times 4.2 × 10−3 Jy beam−1. Colors and lines as in Fig. 4. |
Barbosa et al. (2009) using optical IFU observations inferred the presence of ionized gas outflows mostly in the E − W direction launched at a small angle (< 40°) with respect to the host galaxy. Under this geometry, we would expect some interaction between the AGN wind and the molecular gas in the host galaxy. We find, however, that the typical CO(2-1) velocity residuals (panel e of Fig. 6) are only ∼10 − 20 km s−1 in absolute value. This also supports that the bulk of the cold molecular gas is rotating in the galaxy disk. The most significant velocity residuals are close to the edge of the modeled FoV near the minor axis of the galaxy. However, the extracted spectra in these regions did not show clear evidence for several kinematic components, in part due to the lower S/N in these regions, thus preventing us from any further analysis.
4.3. NGC 4253 (Mrk 766)
NGC 4253 is a Seyfert 1.5 (Osterbrock & Pogge 1985; Osterbrock & Martel 1993). It shows a large scale bar at a PA ∼ 108°, which is asymmetric (7″ + 9″ diameter) with respect to the nucleus (Alonso-Herrero et al. 1998; Márquez et al. 1999, see Fig. 8), and possibly a nuclear bar with a radius of 1″ at a PA of 5° (Márquez et al. 1999). Mulchaey et al. (1996b) obtained ground-based narrow-band images of the [OIII] and Hα ionized gas emission of this galaxy. Their [OIII]/Hα excitation map shows a biconical morphology, which is more apparent to the SE, with a PA = 160° and a large opening angle of 110°. Nagar et al. (1999) derived a similar PA for the radio emission at 3.6 and 20 cm.
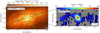 |
Fig. 8. Same as Fig. 1 but for NGC 4253. CO(2-1) integrated-intensity contours: 0.3 (5σ, σ = 0.063 Jy km s−1 beam−1), 1.0 and from 1.5 to 9 Jy km s−1 beam−1, in steps of 1.5 Jy km s−1 beam−1. |
4.3.1. Morphology
According to our fit of the 1.3 mm continuum (see Fig. 9 a and Table 4), this source is only marginally resolved. The AGN coordinates obtained from 1.3 mm continuum with the UV_FIT task are in excellent agreement (differences of less than 0 1) with those derived from radio observations (Kukula et al. 1995; Thean et al. 2001).
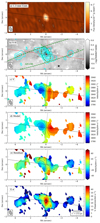 |
Fig. 9. From top to bottom: 1.3 mm continuum image, the CO(2-1) integrated intensity contours overlaid on the V − H color map, the CO(2-1) observed mean velocity field, the 3DBAROLO velocity model, the residual velocity map (observed-model), and the CO(2-1) observed velocity dispersion map. Green dashed ellipses depicted in panel b are examples of x1 and x2 orbits induced by the main stellar bar assuming the parameters obtained by Alonso-Herrero et al. (1998) and a bar width equal to that of the nuclear region (2 |

The only previous CO detection in this galaxy is that of the CO(1-0) single-dish observations (Maiolino et al. 1997, see also Taniguchi et al. 1990; Vila-Vilaró et al. 1998). Thus, we present in Fig. 8, right panel, the first high-resolution observations of CO(2-1) emission in NGC 4253. The CO(2-1) emission extends for almost 8″ ≃ 2.2 kpc, but most of the emission is concentrated in the inner 2″ ≃ 0.5 kpc, and it peaks at the AGN position. This centrally peaked emission has a disk-like morphology oriented at an approximate PA of 30°, and is similar to that traced by the NIR H2 2.12 μm line (Schönell et al. 2014). The fainter extended CO(2-1) emission is observed as two distinct regions (hereafter east and west clouds, respectively) located almost symmetrically  (∼0.8 kpc) to the east and west of the AGN and are coincident with dust lanes observed in the V − H color map presented by Martini et al. (2003) (see also Fig. 9b).
Unfortunately, the HST images for this galaxy are saturated at the AGN position, and thus it is difficult to interpret them near the nucleus of the galaxy (see Fig. 9b, and also Malkan et al. 1998; Martini et al. 2003). The large scale V − H map shows redder colors to the north, suggesting that this is the near side of the galaxy. The concave sides of the leading edges of the main bar (see below) are redder than the convex ones, suggesting that the gas motion is clockwise.
As mentioned above, Alonso-Herrero et al. (1998) modeled the main bar of NGC 4253 (see Table 2). We show an example of an x1 orbit of their model in Fig. 9b with a green dashed line. To do that, we assumed that the width of the bar is that of the nuclear region (2 1). Assuming that the motion of the gas is clockwise in the plane of the galaxy, this figure clearly shows that the east and west clouds are located right at the leading edges of the main bar. This behavior has been found in many other galaxies (e.g., Sheth et al. 2002). The assumption that the cold molecular gas distribution is mainly the result of the main stellar bar is also supported by the location of star-forming regions, traced by bright knots in the near-ultraviolet (near-UV; Muñoz Marín et al. 2009) in the leading side of the east cloud (e.g., Sheth et al. 2002; Heller & Shlosman 1994). This cloud is also spatially coincident with Hα emission (Gonzalez Delgado & Pérez 1996). On the contrary, no significant Hα nor near-UV emission is seen in the location of the west cloud.
The main bar of NGC 4253 is relatively strong since the dust lanes (Martini et al. 2003, see also Fig. 9b) along it are nearly straight (Athanassoula 1992). This kind of bar is supposed to be more efficient in transporting gas towards nuclear regions (e.g., Kuno et al. 2008). In fact, the majority of the CO(2-1) emission is concentrated in the nuclear region (r ∼ 1″). Additionally, it shows strong Hα emission, and it is the brightest region in the near-UV (Muñoz Marín et al. 2009; Gonzalez Delgado & Pérez 1996), undoubtedly tracing nuclear star formation.
We also show an example of an x2 orbit (PA = 18°) in Fig. 9b, which clearly suggests that the CO concentration in this region is, at least in part, the result of the gas motion in such orbits in the main-bar potential. If it exists, the secondary, nested bar (Márquez et al. 1999) could also have favored the concentration of the gas in the nuclear region.
The [OIII] distribution in NGC 4253 is quite concentrated around the nucleus, showing a nearly circular shape of 1 9 diameter in both ground-based and HST observations (Mulchaey et al. 1996b; Schmitt et al. 2003). However, the excitation map presented by Mulchaey et al. (1996b) suggests that this galaxy has a ionization bicone with a large projected opening angle (see Table 2). The cone to the SE of the nucleus is the most prominent, suggesting that is the approaching one.
4.3.2. Kinematics
The observed CO(2-1) mean velocity field (Fig. 9, panel c) shows a general rotating pattern, but it is quite flat due to the low inclination of the galaxy. The shapes of the isovels are different in the receding side, where they have a rigid body-like shape, and in the approaching one, where they resemble to that of a “spider diagram”.
As with Mrk 1066 (Sect. 4.1), the CO(2-1) observed mean velocity dispersion map presents the highest values in an oval structure centered at the 1.3 mm continuum peak. It also shows relatively high values in two finger-like structures, which begin from the ends of the oval structure at ∼0 8 from the nucleus and extend ∼0
 6 to the east and west, respectively. The two clouds to the east and west also show relatively high velocity dispersions, especially the east one. Such enhancements could be due to streaming motions in the leading edges of the main bar.
The fitted 3DBAROLO model reproduces the overall rotating pattern. Our systemic velocity is compatible with most of the values reported in the literature (e.g., Gonzalez Delgado & Pérez 1996; Schnorr-Müller et al. 2014). The derived inclination from the cold molecular gas kinematics (i = 31°) is similar to that derived from the NIR Paβ and H2 2.12 μm emission lines (Schönell et al. 2014) and slightly higher than that derived from the modeling of the stellar kinematics (18.2°, Riffel et al. 2017). Our derived PA is almost the same as those obtained by Schönell et al. (2014) but 13° larger than the stellar one. It should be noted that the disk of NGC 4253 has a low inclination, and, thus, the fitting is more sensitive to small variations, which can explain these deviations.
Although the velocity residuals (Fig. 9, see also the middle panel of Fig. 11) are not strong (≤40 km s−1 in projection or [(vobs − vmodel)/sin(i)] ≤ 78 km s−1 deprojected, both in absolute value), they show an S-pattern that is not antisymmetric with respect to the nucleus. Such features might be related to a bad fit of the model (e.g., van der Kruit & Allen 1978). However, we allowed all our five parameters to vary in the first run with 3DBAROLO, we tested different input values and we obtained similar values. Moreover, this pattern is unlikely the result of an offset between our assumed AGN location and the real one (see Fig. 1 in van der Kruit & Allen 1978) since it is in excellent agreement with that of the radio observations (see above). On the other hand, the S-pattern appears to be related to the leading edges of the main bar. Theoretical and observational arguments show that the isovels tend to warp along the major axis of the bar (e.g., Huntley 1978; Buta 1987; Mazzalay et al. 2014, and references therein).
The position-velocity diagram along the minor axis (Fig. 10) shows some gradient in velocity in the inner ∼2″, which is more evident in the blueshifted noncircular motions to the SE. In other words, the emission to the SE along the minor axis shows more negative velocities than those predicted by the 3DBAROLO model. Given the orientation of the galaxy and that these regions are within the nuclear bar corotation3, the noncircular motions are compatible with an inflow.
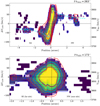 |
Fig. 10. Position-velocity diagrams taken along the kinematic major (PA ∼ 263°) and minor (PA ∼173°) axes of NGC 4253 extracted with 3DBAROLO. Contours are 1 (3σ, see Table 3), 2, 4, 8, 16, and 32 times 3.0 × 10−3 Jy beam−1. Colors and lines as in Fig. 4. |
To illustrate the complexity of the molecular gas kinematics in the nuclear region of NGC 4253, we extracted spectra of selected regions close to the minor axis (regions A–D in Fig. 11). The A spectrum is an example of the findings in the majority of these regions. Although this region displays a relatively high velocity dispersion (∼ 30 km s−1), and the velocity residuals (∼15 km s−1) are close to our resolution (∼13 km s−1), we only see one velocity component. However, the line profile is slightly asymmetric with an excess towards blue velocities. On the other hand, the B–D regions (see Fig. 11) clearly show two velocity components. Assuming that the bright component is associated with the rotating disk, the second velocity component is redshifted (+60 km s−1) to the NW (B area) and blueshifted (on average −60 km s−1) to the SW (C and D areas) of the AGN. We note that these components are shifted in the opposite sense than suggested by the residual map, which points out to the importance of interpreting the residual map along with extracted spectra (see Sect. 3.4).
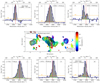 |
Fig. 11. Top and bottom panels: CO(2-1) extracted spectra of NGC 4253 (distances from the AGN are given in the top left or top right boxes of each panel). We extracted the spectra with an aperture equal to the beam size except for the first and last spectra, which are integrated on a circular aperture of radius 0 |

Schönell et al. (2014) modeled the Paβ and warm NIR H2 nuclear kinematics and found clear redshifted noncircular motions to the south and SE of the AGN in their residual maps, which are coincident with the position of the radio jet. In their channel maps, they found both blue and redshifted velocities in [Fe II], Paβ and warm H2, reaching ±250 km s−1 in the [Fe II] line at approximately 0.5″ SE of the AGN. They interpreted the high-velocity ionized gas to the SE (PA ∼ 135°) of the AGN as evidence of an AGN-driven ionized outflow at an orientation close to the plane of the galaxy. However, as we saw in the position-velocity diagram along the kinematic minor axis, in this region, we only found evidence of inflowing motions of the molecular gas.
Finally, we extracted CO(2-1) spectra from the east and west clouds (E and W panels in Fig. 11). The former spectrum only shows one component with a centroid almost coincident with the velocity predicted for the central spaxel of the region by our 3DBAROLO model. In the west cloud (located at 3 2 (0.9 kpc) from the AGN), there is evidence of an additional kinematic component. The brightest peak has a velocity centroid close to the modeled velocity for the central spaxel of the region, but it is blueshifted with respect to it. The other component is fainter and its centroid is blueshifted (approximately 90 km s−1). If we assume that both components are due to motions in the plane of the galaxy, it is reasonable to ascribe the first one to the gas following roughly circular orbits. The extra component, as the motions are detected near the kinematic major axis, is likely related to the tangential motions associated with shocks along the leading edges of the main stellar bar (see Downes et al. 1996, and the discussion above).
4.4. NGC 4388
This highly inclined Seyfert 1.9 (Mason et al. 2015, see Fig. 12) has been classified as a “changing-look” AGN, because it shows rapid (timescales of hours) changes in the X-ray absorption state (Elvis et al. 2004). When in a normal state, it is classified as Compton thin (e.g.,  cm−2, Iwasawa et al. 2003; N
 cm−2, Miller et al. 2019). NGC 4388 belongs to the Virgo cluster and is located close to its center. Although it has a recession velocity of ∼2500 km s−1, around 1500 km s−1 are due to its falling towards the center of the cluster (Yoshida et al. 2002). On large scales, it shows a long tail detected in HI, starting on the east side of the galaxy and extending northeastward up to ∼130 kpc (Yoshida et al. 2002; Vollmer & Huchtmeier 2003; Oosterloo & van Gorkom 2005). This tail has been interpreted as the consequence of a long-lived ram-pressure-stripping process that also explains why NGC 4388 is deficient in HI gas (Vollmer & Huchtmeier 2003; Oosterloo & van Gorkom 2005; Chung et al. 2009; Pappalardo et al. 2012). Closer to the nucleus but still on large scales, there is a plume (detected in Hα and [OIII]) with PA ∼35° and reaching ∼4 kpc from the nucleus.
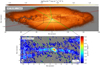 |
Fig. 12. NGC 4388. Top: HST/WFC3/UVIS F814W (∼I band) image. Bottom: NOEMA CO(2-1) integrated intensity map (0th moment). CO(2-1) integrated intensity contours: σ = 0.28 Jy km s−1 beam−1, 1.0 (∼3.6σ) and from 1.5 to 7.5 Jy km s−1 beam−1, in steps of 1.5 Jy km s−1 beam−1. The star marks the assumed location of the AGN, which in this case corresponds to the 21 cm continuum peak from VLBI observations (Giroletti & Panessa 2009), since this is the only source in which we did not detect the 1.3 mm continuum (see text for futher details). Lines and other details as in Fig. 1. |
The [OIII] line emission on large scales shows a V-shape pattern, characteristic of a biconical outflow. This emission is considerably more prominent towards the SE. Mulchaey et al. (1996a) modeled the emission and inferred that the NE cone has a different axis and opening angle than the SW cone (see Table 2). In the central few arseconds, there is a good match between the [OIII] spatial distribution and that of the [Si VI], which benefits from the lower extintion in the NIR (Greene et al. 2014). The nuclear radio jet of this galaxy has a PA = 24° (Greene et al. 2013).
4.4.1. Morphology
This galaxy is the only one in our sample without a 1.3 mm continuum detection. The 3σ upper limit is 276 μJy beam−1. We note that the σ in this case is at least two times higher than in the other four cases (see Table 3), which is likely the main reason for the non-detection. Owing to that, we assumed the AGN location as that of the 21 cm radio-continuum peak (RA (J2000) = 12h25m46.75s, Dec (J2000) = 12° 39′43.51″) from VLBI observations (Giroletti & Panessa 2009). This position produces a symmetric rotation curve while that from VLA observations (Carral et al. 1990), previously the most accurate one, does not. The VLBI coordinates are also in better agreement with those of the point source seen in hard X-ray (Iwasawa et al. 2003) and those of the 33 GHz (9.1 mm) continuum peak (Kamali et al. 2017).
The large scale CO(2-1) line emission of NGC 4388 (Fig. 12, bottom panel) shows a disk-like morphology, extending out to the edges of our FoV in an approximate east-west direction for at least 20″ (∼2 kpc). This extended CO(2-1) morphology towards the SE and NW roughly resembles the spiral arms seen at other wavelengths (Veilleux et al. 1999b; Greene et al. 2014; Vargas et al. 2019). Overall, the CO(2-1) emission follows the dust lanes seen in the I − H color map reasonably well (see Fig. 13a). Since these dust lanes are mainly located on the north side, we assumed this is the near side of the galaxy. The CO(2-1) emission does not trace the Hα emission in the central few arcseconds, which is mostly associated with the southern ionization cone, or the Brγ or [SiVI] emissions that trace the emission on both sides of the ionization cone (Greene et al. 2014).
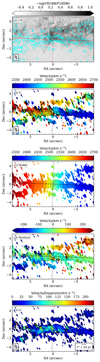 |
Fig. 13. NGC 4388. From top to bottom: CO(2-1) integrated intensity contours overlaid on the I − H color map, CO(2-1) observed mean velocity field, velocity model, residual velocity map (observed-model), and CO(2-1) observed velocity dispersion map. The white star shows the adopted AGN position. The rest is as in Fig. 2. Contours: CO(2-1) integrated intensity contours are the same as in Fig. 1. Velocity contours (b and c panels) are from 2335 to 2700 km s−1 in steps of 20 km s−1. Residual velocity contours are from −200 to 200 km s−1 in steps of 30 km s−1. Velocity dispersion contours are in steps of 30 km s−1, starting at 30 km s−1. |
The most striking feature in the central few arcseconds in the CO(2-1) intensity map (Fig. 12, bottom panel) is that the emission peak is located 1 7 (∼150 pc) from the assumed AGN position in an elongated structure. The morphology and kinematics (see below) seem to suggest that this structure is part of a circumnuclear ring or a nuclear disk with an approximate radius of 2
  5, which would be partially co-spatial with the stellar nuclear disk (r ∼ 1″) reported by Greene et al. (2013, 2014). We note that the NUGA survey showed that strongly lopsided rings or disks are not uncommon in the circumnuclear regions of Seyfert galaxies (e.g., García-Burillo et al. 2003, 2009; Combes et al. 2009). However, the NIR H2 emission is brighter east of the nucleus, coinciding with a σ-drop found in the stellar kinematics (Greene et al. 2014). However, this component has a secondary peak which is approximately spatially coincident with that of the CO(2-1).
The ring/disk accounts for a large fraction of the CO(2-1) line emission in the central regions of NGC 4388. A similar situation was observed in NGC 2273 (Sect. 4.2) and other Seyfert galaxies (e.g., Alonso-Herrero et al. 2019; Rosario et al. 2019). Remarkably, the morphology of the central 5″ CO(2-1) emission is similar to that of the H2/Brγ map that roughly traces the excitation conditions of the warm molecular gas (Greene et al. 2014). At the AGN location, this ratio is low, as was found in other Seyfert galaxies, and thus consistent with the CO(2-1) deficit observed there. As we move outwards from the AGN position, the H2/Brγ ratio increases and takes values consistent with those observed in the spiral arms of other galaxies while at the same time the CO(2-1) emission becomes brighter.
4.4.2. Kinematics
The observed CO(2-1) mean velocity field of NGC 4388 is complicated, but it shows clear signs of rotation outside the nuclear region (Fig. 13, panel b), as already observed for the warm molecular gas traced by the NIR H2 2.12 μm line (Greene et al. 2014). The deviations from a pure rotational pattern are mostly located in regions a few arcseconds to the SE and the NW of the AGN. These may correspond with the leading edges of the main bar, which was needed to reproduce the much less distorted Hα+[NII] velocity field (Veilleux et al. 1999a). Moreover, other factors such as the presence of an ionization cone, a radio jet, and a ram-pressure-stripped process resulting from the infalling of the galaxy in the Virgo cluster environment (see Yoshida et al. 2002, and references therein for a dicussion) might also be, at least in part, responsible for such deviations. We come to this issue later.
The 3DBAROLO model for NGC 4388 (Fig. 13, panel c and the parameters are listed in Table 5) reproduces the overall observed CO(2-1) mean velocity field over the approximate modeled 18″ × 10″ (1.7 kpc × 0.9 kpc) FoV. The systemic velocity roughly agrees with that derived from the stellar (Greene et al. 2014), Hα+[NII] (Veilleux et al. 1999a) and HI (Lu et al. 1993; Vollmer & Huchtmeier 2003) kinematics and radio components (Kukula et al. 1995). Furthermore, the inclination and the PA are also consistent with those obtained from the Hα+[NII] kinematics (Veilleux et al. 1999a).
The CO(2-1) mean velocity residual map of NGC 4388 (Fig. 13, panel d) shows that along the kinematic major axis, the residuals are relatively small and below 50 km s−1 (see also the p–v diagram along the major axis in Fig. 14). The largest velocity residuals (∼250 km s−1 projected, in absolute value) are to the NW (redshifted) and to the SE (blueshited) extending east-west over the entire FoV modeled with 3DBAROLO. These residuals are similar to those obtained by Veilleux et al. (1999a) when modeling the Hα velocity field with a rotating disk model over a larger FoV than ours. Veilleux et al. (1999a) were able to reproduce the strong noncircular streaming motions, revealing a local “inflow”, as due to the presence of a large-scale stellar bar with a deprojected radius of 1.5 kpc with a projected PA = 100°.
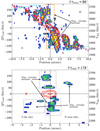 |
Fig. 14. Position-velocity diagrams taken along the kinematic major (PA ∼ 88°) and minor (PA ∼178°) axes of NGC 4388 extracted with 3DBAROLO. Contours are 1 (∼3σ, see Table 3), 2, 4, and 8 times 1.0 × 10−2 Jy beam−1. Orange dashed lines (top panel) enclose the emission inside 1″ from the assumed nucleus which show noncircular motions. The rest is as in Fig. 4. |
The position-velocity diagram taken along the major axis of NGC 4388 (Fig. 14, upper panel) shows that the CO(2-1) emission is asymmetric and more intense to the west. The projected rotation amplitude is around 150 km s−1. The velocity gradient at the nucleus is ∼300 km s−1, which is a signature of deviation from pure rotation (see the areas enclosed by the orange dashed lines in the upper panel of Fig. 14). As the bar proposed by Veilleux et al. (1999b) for this galaxy is almost edge-on (the major axis of the bar is almost perpendicular to the line of sight), these central deviations can be interpreted as molecular gas following the x2 orbits induced by the bar in the central regions, probably forming a disk or ring (see Figs. 4 and 5 of Bureau & Athanassoula 1999). In the position-velocity diagram taken along the minor axis (PA∼178°), a gradient is also detected within 1″ of the nucleus. The velocities of this gradient are preferentially redshifted to the south and blueshifted to the north. Assuming that the north is the near side (see above), it is consistent with an outflow in the plane of the galaxy. This cold molecular outflow is cospatial with the base of the radio lobe (Hummel & Saikia 1991; Irwin et al. 2019). We note that the PA of the 100 pc scale radio jet (PA ∼30°) is quite different from the direction of the molecular outflow (178–358°). We also note the projection to the north of the molecular outflow is not cospatial with the corresponding projected ionization cone (see Fig. 12).
The position-velocity diagram along the minor axis also shows deviations from pure rotation on larger scales. Between around 1″ and 3″, there is faint emission with observed velocities of up to 150 km s−1 in absolute value. The CO(2-1) emission shows blueshifted velocities to the S and redshifted to the N. If we assume that these motions are in the galaxy plane, then they are consistent with a local inflow. In this case, these streaming motions are naturally associated with the presence of the large-scale stellar bar.
4.5. NGC 7465 (Mrk 313)
NGC 7465 (Fig. 15, left panel) belongs to the NGC 7448 group. Inside this group, there is a compact subgroup with NGC 7463, NGC 7464, UGC 12313, and UGC 12321 (Van Driel et al. 1992). It is classified as a barred galaxy in the Third Reference Catalog of Bright Galaxies (RC3; De Vaucouleurs et al. 1991). However, there are only a few discussions in the literature about the possible presence of a bar in this galaxy and no properties (PA, length) are reported (see e.g., Khachikyan & Petrosyan 1983; Van Driel et al. 1992). The optical continuum images of this galaxy (Van Driel et al. 1992; Ferruit et al. 2000; Merkulova et al. 2012) show isophotes roughly elliptical beyond r > 10″ elongated at PA = 160–165°. In Fig. 15, we assumed that these isophotes trace the main bar. The molecular and ionized gas components as well as the stellar component of this galaxy at scales of a few arcseconds appear to show different kinematic axes. All this is a clear signature of the recent/ongoing interaction between NGC 7465 and one or more galaxies of its surroundings (Van Driel et al. 1992; Li & Seaquist 1994; Thomas et al. 2002; Merkulova et al. 2012; Alatalo et al. 2013). The interaction with NGC 7464 is likely taking place since there is an HI spiral arm that connects the SE of NGC 7465 with the SW of NGC 7464, and the latter galaxy exhibits photometric distortions in the direction towards the former. Moreover, the existence of misaligned gas, the presence of low stellar metallicities, and a high α-element to iron ratio in the central region of NGC 7465 were interpreted as a sign that this galaxy has accreted gas from an external source (Young et al. 2014).
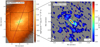 |
Fig. 15. Same as Fig. 1 but for NGC 7465. CO(2-1) integrated-intensity contours: 0.3 (∼4σ, σ = 0.076 Jy km s−1 beam−1) and from 0.5 to 3.0 Jy km s−1 beam−1, in steps of 0.5 Jy km s−1 beam−1. |
NGC 7465 is the least luminous galaxy in X-rays of our sample (see Table 1). Its optical classification is between Seyfert 2 and a low-ionization nuclear emission-line region (LINER, e.g., Ferruit et al. 2000). However, Ramos Almeida et al. (2009) classified it as a type-1 LINER based on the presence of broad lines in their NIR long-slit spectra. Guainazzi et al. (2005) classified its nucleus as a Compton-thin but highly absorbed (NH ∼ 5 × 1023 cm−2) source. Müller-Sánchez et al. (2018) suggested the presence of a double nucleus in this galaxy based on the non-point-like shape of their 2.12 μm continuum.
4.5.1. Morphology
The nuclear source in the 1.3 mm continuum image (Fig. 16d) is detected at a 8σ level. We had to fix the size of the Gaussian function to be able to fit it in the uv-plane. The AGN coordinates obtained from 1.3 mm continuum are in excellent agreement with those derived from the 5 GHz (6 cm) continuum (Nyland et al. 2016). The resulting parameters indicate that the source is resolved along PA ∼113° (i.e., the minor axis of the beam of the observations) but not in the perpendicular direction, where previous radio works suggested extended emission (Nagar et al. 1999; Mundell et al. 2009). The [OIII] emission in the inner 2″ has a PA = 135° (Ferruit et al. 2000). We point out that the region surrounding the nucleus but not the nucleus itself displays the highest values in the V − H color map suggesting strong reddening due to dust.
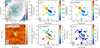 |
Fig. 16. Same as Fig. 2, but for NGC 7465. Velocity contours in panels b and c are from 1860 to 2100 km s−1 in steps of 20 km s−1. Continuum contours are −3σ (white dashed line), 3σ and 6σ (white solid line) with σ = 30 μJy beam−1. The residual velocity contours are from −50 to 50 km s−1 in steps of 10 km s−1. The velocity dispersion contours are in steps of 10 km s−1, starting at 10 km s−1. |
Alatalo et al. (2013) classified the cold molecular gas morphology of NGC 7465 as mildly disrupted, based on the Combined Array for Research in Millimeter-wave Astronomy (CARMA) CO(1-0) ∼5.5″ resolution observations. Our NOEMA CO(2-1) line emission map (Fig. 15, right panel) clearly resolves the central emission in a set of spiral arms on scales of up to 5″ (∼500 pc) from the AGN. The spiral arms appear to be spatially coincident with regions of higher extinction in the V − H color map (Fig. 16, panel a) as well as some of the HII regions detected in the Hα+[NII] map of Ferruit et al. (2000). The nuclear region shows a double CO(2-1) peak in an elongated bar-like structure. None of the nuclear CO(2-1) peaks coincide with the 1.3 mm continuum peak believed to mark the location of the AGN. Finally, the SE of the galaxy presents redder colors, suggesting that it is the near side.
4.5.2. Kinematics
The NOEMA observed CO(2-1) velocity field exhibits an overall rotating pattern (Fig. 16, panel b). However, the PA of the kinematic major axis clearly increases as we move away from the nuclear region. For example, this can be seen to the SE along the minor axis where the velocities near the nucleus are around 1975 km s−1, while, at a radius of ∼3″5, the velocities are ∼2025 km s−1 (see Fig. 16, panel b, and also Fig. 17, bottom panel). Most of the molecular gas in the NE side (as a whole) of the central 12″ of NGC 7465 recedes from us, while that in the SW side approaches. This orientation is rather different from that observed with the CO(1-0) transition at ∼5.5″ resolution (Alatalo et al. 2013). On larger scales, the cold molecular gas is oriented in an approximate east-west direction (∼106°), which is also similar to that of the Hα emitting gas (Merkulova et al. 2012). At radial distances greater than 10″, the photometric major axis of the galaxy is PA = 160° (Merkulova et al. 2012). Regarding the correspondence with the highly ionized gas emission, the [OIII] emission in the nuclear region (r < 2″) is perpendicular to that of the CO(2-1). Further away, the former is much more diffuse and seems to be mostly related to HII regions (Ferruit et al. 2000). The observed mean velocity dispersions are overall below ∼30 km s−1 except at the AGN position.
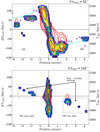 |
Fig. 17. Position-velocity diagrams taken along the kinematic major (PA ∼ 52°) and minor (PA ∼142°) axes of NGC 7465 extracted with 3DBAROLO. Contours are 1 (3σ, see Table 3), 2, 4, and 8 times 3.6 × 10−3 Jy beam−1. Dotted lines enclose the emission outside the inner 1″. Colors and lines as in Fig. 4. |
Despite the complex kinematics in the inner 12″ of NGC 7465, we still attempted a 3DBAROLO fit, as explained for the other galaxies (see Sect. 3), by keeping the disk PA and i fixed in the second run. The model reproduces the general behavior of the observed velocity (Fig. 16 panels b and c, and the model parameters are given in Table 5) but it fails to account for the molecular gas motions with strong signs of perturbation. The systemic velocity obtained from the 3DBAROLO fit is almost in the middle of the values derived from the stellar (1963 km s−1, Merkulova et al. 2012) and HI (1989 km s−1, Li & Seaquist 1994) components. The aforementioned moderate resolution CO(1-0) observation suggests a systemic velocity near the stellar one (1960 km s−1, Alatalo et al. 2013). Regarding the inclination, the average value derived with 3DBAROLO is similar to that obtained from a tilted-ring method for the main stellar disk (Merkulova et al. 2012) and quite different from the inclination derived for molecular gas on larger scales (∼70°, see Alatalo et al. 2013). The average PA derived from our CO(2-1) data is far from the values of both the stellar and CO(1-0) components (PAstar = 160°, PACO(1 − 0) = 106°). At face value, we could interpret this result as a kinematical decoupling of the molecular gas in the inner 12″ with respect to the stellar and gas kinematics on larger scales. However, we cannot rule out that this is due to differences in the angular resolution, radial coverage, and/or modeling strategies of the different tracers.
The larger CO(2-1) mean velocity residuals (≤70 km s−1 in projection, i.e, [(vobs − vmodel)/sin(i)] ≤ 88 km s−1, see Fig. 16, panel e) are found in the nuclear region of NGC 7465. This region appears to be further decoupled from that on larger scales of 12″ of our NOEMA FoV, and in the two clouds 5″ to the south and 3″ to SE. The velocity residuals of these two clouds can be explained by the approximately constant, counterclockwise change of the PA of the kinematic major axis, since they are the most distant structures from the nucleus. This is understood because the average PA in the 3DBAROLO model is strongly biased to that of the brighter regions, that is, the inner ones. In other words, these two clouds belong to regions rotating close to the orientation seen on larger scales with CO(1-0).
The residual pattern outside the nuclear region at radial distances greater than approximately 2″ shows positive/negative residuals to the SE/NW. These deviations from pure rotation are clearly seen in the position-velocity diagram along the minor axis (bottom panel of Fig. 17) and reach approximately projected velocities of +50 km s−1 to the SE and −80 km s−1 to the NW. If these motions are taking place in the galaxy disk, they are compatible with a local inflow. In such a case, the streaming motions might be due to the suspected main bar (see above).
5. Molecular gas masses
We measured the CO(2-1) integrated intensity by fitting Gaussians (similar to the fits done in Figs. 3 and 11) to spectra extracted with three apertures. The first has a size equal to the beam and typically covers the central ∼100 pc (see Table 6 for the actual sizes) and is referred to as nuclear aperture. The second is a circular aperture with a 4″ diameter covering physical scales of 0.4–1.1 kpc (circumnuclear apertures). These will allow us to compare with properties measured from Spitzer spectroscopy in forthcoming works. The last one is also a circular aperture but with a 11–12″ diameter, which is suitable to compare our recovered fluxes with those of the single-dish observations, and corresponds to 1.0–3.3 kpc. The uncertainties of the CO(2-1) integrated intensity listed in Table 6 for all apertures come from the Gaussian fitting.
CO(2-1) integrated fluxes and derived molecular gas masses in several apertures.
Since interferometric observations may miss some of the total flux, we searched the literature for single-dish observations. We estimated the missing flux by integrating the density flux (without applying any threshold) of the interferometic observations over an aperture equal to that of the single-dish observations and over a similar spectral width (e.g., Ueda et al. 2014). We estimated the conversion factor between Jy and K through the formula: Sν/Tmb = 8.16 × 10⁻⁷(ν(GHz))2(θbeam(arcsec))2 (e.g., Grossi et al. 2016). For Mrk 1066, Krügel et al. (1990) obtained an integrated flux of 297 Jy km s−1 in a 12″ aperture while we measured 65 Jy km s−1, that is, we recovered ∼22% of the flux measured by the single-dish. For NGC 2273, our 11–12″ measurement recovers most of the single-dish flux observed by Albrecht et al. (2007) and approximately 30% of the 21″ James Clerck Maxwell Telescope (JCMT) flux derived by Petitpas & Wilson (2003). However, we note that the Krügel et al. (1990) 11″ single-dish measurement is approximately half that obtained by Albrecht et al. (2007). For NGC 7465, we recovered ∼34% of the flux measured by Young et al. (2011) for an 11″ aperture. Finally, in the case of NGC 4388, we recovered ∼67% of the flux for an 11″ aperture measured by Verdugo et al. (2015). As we mentioned before, there are no previous observations in CO(2-1) for NGC 4253, so we cannot estimate the missed flux for this source.
To derive the molecular gas masses, we used Eq. (2) from Sakamoto et al. (1999):
![$$ \begin{aligned} \Bigg (\frac{M_{H_{2}}}{M_{\odot }}\Bigg )&= {1.18 \times 10^{4}} \times \Bigg (\frac{D^{2}_{L}}{\mathrm{Mpc}}\Bigg ) \times \Bigg (\frac{S_{\rm CO(1-0)}}{\mathrm{Jy\,km\, s}^{-1}}\Bigg ) \nonumber \\&\quad \times \Bigg [\frac{X_{\rm CO}}{3.0 \times 10^{20}\,\mathrm{cm}^{-2} \ ({\mathrm{K\,km\,s}}^{-1})^{-1}}\Bigg ], \end{aligned} $$](/articles/aa/full_html/2020/11/aa36961-19/aa36961-19-eq22.gif)
taking XCO = 2 × 1020 cm−2 (K km s−1)−1 (Bolatto et al. 2013) and assuming a brightness temperature ratio, r21 = CO(J = 2-1)/CO(J = 1-0), of 0.89 ± 0.06 (Braine & Combes 1992). XCO is the typical Galactic conversion factor and is consistent with the resolution of our observations (∼100 pc) according to numerical simulations (Gong et al. 2018). r21 was obtained from measurements in the inner kpc of nearby galaxies and could vary depending on excitation mechanisms in different regions of the galaxy (e.g., between arm and inter-arm regions Hasegawa 1997, or between nuclear and further regions García-Burillo et al. 2009). It could also be different in isolated and perturbed galaxies (Braine & Combes 1992). Estimations of r21 were reported for NGC 2273 and NGC 7465, 0.88 ± 0.26 (Petitpas & Wilson 2003) and 0.95 ± 0.04 (Crocker et al. 2012), respectively, which are consistent with our assumed ratio.
The derived molecular gas masses (see Table 6) range from 2 × 10⁶ to 5 × 10⁷ M⊙ and from 2 × 10⁷ to 3 × 10⁸ M⊙ in the nuclear and circumnuclear apertures, respectively. As suggested by their morphologies, in Mrk 1066 and NGC 4253 the CO(2-1) emission is more centrally peaked than in NGC 2273 and NGC 4388. Thus, the former galaxies have higher nuclear to circumnuclear CO(2-1) ratios (0.15) and corresponding molecular gas mass ratios than the latter (0.03–0.07).
The circumnuclear cold molecular gas masses are typical values for Seyfert galaxies (e.g., Schinnerer et al. 2000a; Hicks et al. 2009; Sani et al. 2012; García-Burillo et al. 2014). The NOEMA nuclear apertures cover physical sizes smaller than 100 pc, except for the most distant galaxy in our sample (NGC 4253). All the nuclear cold molecular gas masses for our sample are comparable to those measured in nuclear disks/tori of local low-luminosity AGN on scales covering a few tens of parsecs with ALMA (Alonso-Herrero et al. 2018; Combes et al. 2019).
6. Discussion
As stated in the introduction, our main goal is to investigate the kinematics of the cold molecular gas in nearby Seyfert galaxies and look for evidence of noncircular motions. In this section we compare the kinematics of the cold molecular gas and the ionized gas, and discuss in detail the results for the molecular outflow detected in Mrk 1066.
6.1. Kinematics of the cold molecular gas and ionized gas
In this section, we put together the results from the individual source analysis (Sect. 4) and discuss how the noncircular motions relate to the presence of large scale bars and ionized gas outflows. In Table 7, we summarize the main results from the molecular gas kinematics and list some properties of the ionized gas outflows in our sample from the literature, including the maximum velocity and the ionized gas line used.
Summary of the kinematics.
The first result from this table is that the cold molecular gas in all five galaxies shows a clear rotational pattern on the scales probed by the NOEMA observations (a few hundred pc). Among them, three have signs of streaming motions along bars and/or spiral arms, two exhibit signs of outflowing material, and only one shows evidence of both. NGC 2273 is the only galaxy for which we did not find any evidence of streaming or outflowing motions.
The observed maximum velocities of the streaming motions range from 50 to 250 km s−1 in absolute value. These velocities correspond to deprojected velocities in the range ∼63–252 km s−1. We calculated the deprojected values by using [(vobs − vmodel)/sin(i)]. From those values, we conclude that the presence of bars affects the kinematics of the cold molecular gas on scales of hundreds of parsecs and the deviations from circular motions ascribed to them can be higher than those related to outflowing material for this phase (see below). It is therefore necessary to take them into account before looking for signs of molecular outflows.
Regarding the molecular outflows, the maximum observed velocities (in absolute value) are in the range from 30 to 150 km s−1, which corresponds to deprojected velocities in the range ∼40–151 km s−1, assuming that the outflows take place in the galaxy disk. These values are similar to those measured from hot molecular gas in the NIR for other Seyfert galaxies (Davies et al. 2014). Additionally, we find that the maximum velocities of the molecular outflows roughly follow the relation found by Fiore et al. (2017). In other words, for the AGN bolometric luminosities of our sample the expected maximum velocities for the molecular gas should be of the order of 100 km s−1. Moreover, the maximum velocity of the outflows in our galaxies (see Table 7) is significantly higher for the ionized phase than the molecular. This suggests that, at least for the AGN luminosities probed here, the cold molecular gas in the galaxy disk is swept up by the AGN wind, rather than being part of the AGN wind. In other words, the bulk effect of the AGN wind is to entrain the cold molecular gas in the galaxy disk, when the geometry is favorable for this. This result is in agreement with previous observations (Davies et al. 2014; García-Burillo et al. 2014, 2019; Alonso-Herrero et al. 2018, 2019). We also emphasize that the geometry and orientation of the ionization cone with respect to the host galaxy play a role on whether we should observe molecular outflows or not. Therefore, a detailed model of this emission (see e.g. Fischer et al. 2013) is necessary for a correct interpretation of the noncircular motions of the molecular gas.
6.2. Nuclear molecular outflow rate in Mrk 1066
Mrk 1066 was the only galaxy where we were able to clearly resolve the molecular outflow components on opposite sides of nucleus and along the minor axis. In this section, we estimate the molecular mass outflow rate. Following García-Burillo et al. (2014), a lower limit of the mass rate of a multiconical outflow uniformly filled by the outflowing clouds can be estimated through the following expression:
where vmax is the maximum observed velocity of the outflow, Mmol is the characteristic mass of the outflow, Rout the projected radius reached by the ouflowing material measured from the AGN position, and γ is the angle between the ionization bicone axis and our line of sight.
We first estimated the molecular mass of the outflow by fitting a Gaussian function to the noncircular motion components seen in the integrated spectra of the two nuclear regions to the NE and SW of the AGN (see Fig. 3) and using the expressions of Sect. 5 to convert the integrated fluxes into molecular gas masses. We obtained M(red − NE) = 1.4 ± 0.2 × 10⁶ and M(blue − SW) = 4.8 ± 0.5 × 10⁶ M⊙, for the masses of the receding and approaching components of the outflow with respect to our line of sight, respectively. Comparing with the circumnuclear region (4″-aperture, see Table 6), it is clear that the outflowing molecular gas mass is only a small fraction of the total mass in this region.
Taking the values of the maximum velocity of the molecular outflow from Table 7,  pc/″ = 105 pc and assuming that the outflow takes place in the plane of the galaxy (tan(γ) = 1/tan(idisk = 50° ), see Sect. 4.1), we obtained Ṁout(NE) ∼ 3.0 and Ṁout(SW) ∼ 3.5 M⊙ yr−1. These values are similar to those found in the nuclear region of NGC 3227 (Alonso-Herrero et al. 2019), but slightly lower than those found in other galaxies either using NIR H2 2.12 μm (Davies et al. 2014) and ALMA CO(2-1) observations (Slater et al. 2019). The mass outflow rates of the molecular gas in Mrk 1066 are about two orders of magnitude higher than the mass outflow rate of the ionized gas (6.2 × 10⁻² M⊙ yr−1, Riffel & Storchi-Bergmann 2011), which is in agreement with previous findings in other moderate luminosity Seyfert galaxies (e.g., Fiore et al. 2017).
7. Summary and conclusions
We presented new NOEMA observations of the CO(2-1) transition and adjacent continuum at ∼1.3 mm of five nearby (DL between 19 and 58 Mpc) Seyfert galaxies. The achieved resolutions were  , which provided physical resolutions ∼30 − 150 pc for the distances of our galaxies. The main conclusions are as follows:
-
1.3 mm continuum: All galaxies but one (NGC 4388) were detected at 1.3 mm. We found that the brightest continuum peak, which is mostly unresolved at our resolution, corresponds to the AGN position as determined by radio observations.
-
CO(2-1) morphology: The NOEMA CO(2-1) integrated line emission has been resolved in the five galaxies and extends over physical scales of 1–2 kpc. The CO(2-1) morphologies resemble nuclear disks (Mrk 1066 and NGC 4253) with the emission peaking at the AGN position and circumnuclear rings/disks (NGC 2273, NGC 4388, and NGC 7465) with several CO(2-1) emission regions not coincident with the AGN position. We also detected CO(2-1) spiral arm like features in the nuclear regions in four of them which were also well traced by dust extinction in V − H or I − H color maps.
-
Molecular gas masses: We measured significant amounts of molecular gas on both nuclear scales (30–150 pc) ranging from 2 × 10⁶ to 5 × 10⁷ M⊙ and circumnuclear scales (0.4–1.1 kpc) ranging from 2 × 10⁷ to 3 × 10⁸ M⊙. These values are similar to those measured in other Seyfert galaxies over similar physical regions.
-
CO(2-1) kinematics: All five galaxies in our sample show clear rotational patterns in the observed CO(2-1) mean velocity field with varying degrees of noncircular motions. The galaxies in group/cluster environments (NGC 4388 and NGC 7465) show more complex CO(2-1) kinematics than those that appear to be isolated or relaxed (NGC 2273, Mrk 1066, and NGC 4253). Three out of the five galaxies show signs of streaming motions along bars and/or spiral arms. Mrk 1066 and NGC 4388 show signs of a molecular outflow (see Table 7). Only one galaxy (NGC 4388) shows both streaming motions and outflows. The typical velocity offsets of these motions (deprojected) with respect to the rotating component are in the range 175–252 km s−1 and 116–151 km s−1, respectively (see summary of the kinematics in Table 7).
Given the AGN luminosities of the galaxies in our sample, the expectation from the observed correlations is molecular outflows with maximum velocities of the order of ∼100 km s−1 (Fiore et al. 2017). However, we only found conclusive signs of molecular gas outflows in Mrk 1066 with an outflow rate of 3 − 3.5 M⊙ yr−1 and tentative evidence in NGC 4388. Although our resolution may have an impact on these results, this clearly shows that it is only in cases of favorable geometry that we will be able to detect them. This includes the AGN wind impacting molecular gas in the host galaxy and noncircular motions close to the minor axis of the galaxy as in the cases of NGC 1068 (García-Burillo et al. 2014, 2019), IC 5063 (Morganti et al. 2015), and NGC 3227 (Alonso-Herrero et al. 2019). We also highlight the importance of assessing other noncircular motions (e.g., streaming motions due to the presence of a bar) which are of similar magnitude to those of AGN-driven outflows expected for moderate-luminosity AGN such as the typical local Seyfert galaxies.
It should be noted that the term “corotation radius” is a generally accepted abuse of language. The corotation region has a certain radial extent (e.g., Combes et al. 2004).
Acknowledgments
We thank the anonymous referee for her or his valuable comments that have improved significantly the quality of the paper. A.A.-H. acknowledges support from the Spanish Ministry of Science, Innovation and Universities through grant AYA2015-64346-C2-1-P, which was party funded by the FEDER program, and A.A.-H., S.G.-B. and A. U. through grant PGC2018-094671-B-I00 (MCIU, AEI, FEDER, EU). S.G.-B. and C.R.A. acknowledge support from Spanish MINECO grant AYA2016-76682-C3-2-P. A.U acknowledges support from Spanish MINECO grants ESP2015-68964 and AYA2016-79006, partly funded by the FEDER program. A.L. acknowledges the support from Comunidad de Madrid through the Atraccián de Talento grant 2017-T1/TIC-5213. A.A.-H. and A. L. work was done under project No. MDM-2017-0737 Unidad de Excelencia “María de Maeztu”- Centro de Astrobiología (INTA-CSIC). M.P.-S. acknowledges support from the Comunidad de Madrid, Spain, through Atracciín de Talento Investigador Grant 2018-T1/TIC-11035 and STFC through grants ST/N000919/1 and ST/N002717/1. The authors wish to thank Erin K. S. Hicks for showing us the OSIRIS data prior to publication. We also wish to thank E. Di Teodoro for giving us the details of how position-velocity diagrams are produced in 3DBAROLO. This work is based on observations carried out under project numbers W14CB and W16BP with the IRAM NOEMA Interferometer. Data reduction was done using the GILDAS software package supported at IRAM (http://www.iram.fr/IRAMFR/GILDAS). Some of the data presented are observations made with the NASA/ESA Hubble Space Telescope, obtained from the data archive at the Space Telescope Science Institute and from the Hubble Legacy Archive. STScI is operated by the Association of Universities for Research in Astronomy, Inc. under NASA contract NAS 5-26555. HLA is a collaboration between the Space Telescope Science Institute (STScI/NASA), the Space Telescope European Coordinating Facility (ST-ECF/ESA) and the Canadian Astronomy Data Centre (CADC/NRC/CSA). This work has also made use of the NASA/IPAC Extragalactic Database (NED) which is operated by the Jet Propulsion Laboratory, California Institute of Technology, under contract with the National Aeronautics and Space Administration. In addition, it is acknowledged the usage of the HyperLeda database (http://leda.univ-lyon1.fr).
References
- Afanasiev, V., Mikhailov, V., & Shapovalova, A. 1998, A&AT, 16, 257 [Google Scholar]
- Aguerri, J. A. L., Méndez-Abreu, J., Falcón-Barroso, J., et al. 2015, A&A, 576, A102 [NASA ADS] [CrossRef] [EDP Sciences] [Google Scholar]
- Alatalo, K., Davis, T. A., Bureau, M., et al. 2013, MNRAS, 432, 1796 [NASA ADS] [CrossRef] [Google Scholar]
- Albrecht, M., Krügel, E., & Chini, R. 2007, A&A, 462, 575 [NASA ADS] [CrossRef] [EDP Sciences] [Google Scholar]
- Alonso-Herrero, A., Simpson, C., Ward, M. J., & Wilson, A. S. 1998, ApJ, 495, 196 [NASA ADS] [CrossRef] [Google Scholar]
- Alonso-Herrero, A., Ramos Almeida, C., Esquej, P., et al. 2014, MNRAS, 443, 2766 [NASA ADS] [CrossRef] [Google Scholar]
- Alonso-Herrero, A., Esquej, P., Roche, P., et al. 2016, MNRAS, 455, 563 [NASA ADS] [CrossRef] [Google Scholar]
- Alonso-Herrero, A., Pereira-Santaella, M., García-Burillo, S., et al. 2018, ApJ, 859, 144 [Google Scholar]
- Alonso-Herrero, A., García-Burillo, S., Pereira-Santaella, M., et al. 2019, A&A, 628, A65 [NASA ADS] [CrossRef] [EDP Sciences] [Google Scholar]
- Athanassoula, E. 1992, MNRAS, 259, 345 [NASA ADS] [CrossRef] [Google Scholar]
- Awaki, H., Terashima, Y., Higaki, Y., & Fukazawa, Y. 2009, PASJ, 61, S317 [Google Scholar]
- Barbosa, F. K. B., Storchi-Bergmann, T., Fernandes, R. C., Winge, C., & Schmitt, H. 2006, MNRAS, 371, 170 [NASA ADS] [CrossRef] [Google Scholar]
- Barbosa, F. K. B., Storchi-Bergmann, T., Fernandes, R. C., Winge, C., & Schmitt, H. 2009, MNRAS, 396, 2 [NASA ADS] [CrossRef] [Google Scholar]
- Bolatto, A. D., Wolfire, M., & Leroy, A. K. 2013, ARA&A, 51, 207 [Google Scholar]
- Bower, G., Wilson, A., Morse, J. A., et al. 1995, ApJ, 454, 106 [NASA ADS] [CrossRef] [Google Scholar]
- Braine, J., & Combes, F. 1992, A&A, 264, 433 [NASA ADS] [Google Scholar]
- Bureau, M., & Athanassoula, E. 1999, ApJ, 522, 686 [NASA ADS] [CrossRef] [Google Scholar]
- Buta, R. 1987, ApJS, 64, 383 [NASA ADS] [CrossRef] [Google Scholar]
- Carral, P., Turner, J. L., & Ho, P. T. 1990, ApJ, 362, 434 [NASA ADS] [CrossRef] [Google Scholar]
- Chen, X., Akiyama, M., Noda, H., et al. 2019, PASJ, 71, 29 [CrossRef] [Google Scholar]
- Chung, A., Van Gorkom, J., Kenney, J. D., Crowl, H., & Vollmer, B. 2009, ApJ, 138, 1741 [CrossRef] [Google Scholar]
- Comastri, A. 2004, Supermassive Black Holes in the Distant Universe (Springer), 245 [NASA ADS] [CrossRef] [Google Scholar]
- Combes, F., Boissé, P., Mazure, A., & Blanchard, A. 2004, Galaxies and Cosmology (Springer Science & Business Media) [Google Scholar]
- Combes, F., Baker, A., Schinnerer, E., et al. 2009, A&A, 503, 73 [NASA ADS] [CrossRef] [EDP Sciences] [Google Scholar]
- Combes, F., García-Burillo, S., Casasola, V., et al. 2013, A&A, 558, A124 [NASA ADS] [CrossRef] [EDP Sciences] [Google Scholar]
- Combes, F., García-Burillo, S., Casasola, V., et al. 2014, A&A, 565, A97 [NASA ADS] [CrossRef] [EDP Sciences] [Google Scholar]
- Combes, F., García-Burillo, S., Audibert, A., et al. 2019, A&A, 623, A79 [NASA ADS] [CrossRef] [EDP Sciences] [Google Scholar]
- Contini, T., Considere, S., & Davoust, E. 1998, A&AS, 130, 285 [NASA ADS] [CrossRef] [EDP Sciences] [Google Scholar]
- Crocker, A., Krips, M., Bureau, M., et al. 2012, MNRAS, 421, 1298 [NASA ADS] [CrossRef] [Google Scholar]
- Davies, R., Förster Schreiber, N. M., Cresci, G., et al. 2011, ApJ, 741, 69 [NASA ADS] [CrossRef] [Google Scholar]
- Davies, R., Maciejewski, W., Hicks, E., et al. 2014, ApJ, 792, 101 [NASA ADS] [CrossRef] [Google Scholar]
- De Vaucouleurs, G., De Vaucouleurs, A., Corwin, H., Jr, et al. 1991, Third Reference Catalogue of Bright Galaxies, 1 [Google Scholar]
- Di Teodoro, E., & Fraternali, F. 2015, MNRAS, 451, 3021 [NASA ADS] [CrossRef] [Google Scholar]
- Downes, D., Reynaud, D., Solomon, P. M., & Radford, S. J. E. 1996, ApJ, 461, 186 [NASA ADS] [CrossRef] [Google Scholar]
- Elvis, M., Risaliti, G., Nicastro, F., et al. 2004, ApJ, 615, L25 [NASA ADS] [CrossRef] [Google Scholar]
- Erwin, P., & Sparke, L. S. 2002, AJ, 124, 65 [NASA ADS] [CrossRef] [Google Scholar]
- Erwin, P., & Sparke, L. S. 2003, ApJS, 146, 299 [NASA ADS] [CrossRef] [Google Scholar]
- Federrath, C., Salim, D. M., Medling, A. M., et al. 2017, MNRAS, 468, 3965 [NASA ADS] [CrossRef] [Google Scholar]
- Ferruit, P., Wilson, A. S., & Mulchaey, J. 2000, ApJS, 128, 139 [NASA ADS] [CrossRef] [Google Scholar]
- Fiore, F., Feruglio, C., Shankar, F., et al. 2017, A&A, 601, A143 [NASA ADS] [CrossRef] [EDP Sciences] [Google Scholar]
- Fischer, T. C., Crenshaw, D. M., Kraemer, S. B., & Schmitt, H. R. 2013, ApJS, 209, 1 [NASA ADS] [CrossRef] [Google Scholar]
- Gallimore, J. F., Elitzur, M., Maiolino, R., et al. 2016, ApJ, 829, L7 [NASA ADS] [CrossRef] [Google Scholar]
- García-Burillo, S., & Combes, F. 2012, J. Phys. Conf. Ser., 372, 012050 [CrossRef] [Google Scholar]
- García-Burillo, S., Sempere, M. J., & Combes, F. 1994, A&A, 287, 419 [Google Scholar]
- García-Burillo, S., Combes, F., Hunt, L., et al. 2003, A&A, 407, 485 [NASA ADS] [CrossRef] [EDP Sciences] [Google Scholar]
- García-Burillo, S., Combes, F., Schinnerer, E., Boone, F., & Hunt, L. 2005, A&A, 441, 1011 [NASA ADS] [CrossRef] [EDP Sciences] [Google Scholar]
- García-Burillo, S., Fernández-García, S., Combes, F., et al. 2009, A&A, 496, 85 [NASA ADS] [CrossRef] [EDP Sciences] [Google Scholar]
- García-Burillo, S., Combes, F., Usero, A., et al. 2014, A&A, 567, A125 [NASA ADS] [CrossRef] [EDP Sciences] [Google Scholar]
- García-Burillo, S., Combes, F., Ramos Almeida, C., et al. 2019, A&A, 632, A61 [CrossRef] [EDP Sciences] [Google Scholar]
- Gimeno, G. N., Díaz, R. J., & Carranza, G. J. 2004, ApJ, 128, 62 [NASA ADS] [CrossRef] [Google Scholar]
- Giroletti, M., & Panessa, F. 2009, ApJ, 706, L260 [NASA ADS] [CrossRef] [Google Scholar]
- Gong, M., Ostriker, E. C., & Kim, C.-G. 2018, ApJ, 858, 16 [NASA ADS] [CrossRef] [Google Scholar]
- Gonzalez Delgado, R. M., & Pérez, E. 1996, MNRAS, 278, 737 [NASA ADS] [CrossRef] [Google Scholar]
- Goodrich, R., & Osterbrock, D. 1983, ApJ, 269, 416 [NASA ADS] [CrossRef] [Google Scholar]
- Greene, J. E., Seth, A., Den Brok, M., et al. 2013, ApJ, 771, 121 [NASA ADS] [CrossRef] [Google Scholar]
- Greene, J. E., Seth, A., Lyubenova, M., et al. 2014, ApJ, 788, 145 [NASA ADS] [CrossRef] [Google Scholar]
- Grossi, M., Corbelli, E., Bizzocchi, L., et al. 2016, A&A, 590, A27 [NASA ADS] [CrossRef] [EDP Sciences] [Google Scholar]
- Guainazzi, M., Matt, G., & Perola, G. C. 2005, A&A, 444, 119 [NASA ADS] [CrossRef] [EDP Sciences] [Google Scholar]
- Haan, S., Schinnerer, E., Emsellem, E., et al. 2009, ApJ, 692, 1623 [NASA ADS] [CrossRef] [Google Scholar]
- Hasegawa, T. 1997, CO: Twenty-Five Years of Millimeter-Wave Spectroscopy (Springer), 39 [CrossRef] [Google Scholar]
- Heller, C. H., & Shlosman, I. 1994, ApJ, 424, 84 [NASA ADS] [CrossRef] [Google Scholar]
- Henkel, C., Peck, A., Tarchi, A., et al. 2005, A&A, 436, 75 [NASA ADS] [CrossRef] [EDP Sciences] [Google Scholar]
- Hernández-García, L., Masegosa, J., González-Martín, O., & Márquez, I. 2015, A&A, 579, A90 [NASA ADS] [CrossRef] [EDP Sciences] [Google Scholar]
- Hicks, E., Davies, R., Malkan, M., et al. 2009, ApJ, 696, 448 [NASA ADS] [CrossRef] [Google Scholar]
- Hönig, S. F., & Kishimoto, M. 2017, ApJ, 838, L20 [NASA ADS] [CrossRef] [Google Scholar]
- Hönig, S. F., Kishimoto, M., Gandhi, P., et al. 2010, A&A, 515, A23 [NASA ADS] [CrossRef] [EDP Sciences] [Google Scholar]
- Hummel, E., & Saikia, D. 1991, A&A, 249, 43 [Google Scholar]
- Huntley, J. M. 1978, ApJ, 225, L101 [NASA ADS] [CrossRef] [Google Scholar]
- Iorio, G., Fraternali, F., Nipoti, C., et al. 2016, MNRAS, 466, 4159 [Google Scholar]
- Irwin, J., Damas-Segovia, A., Krause, M., et al. 2019, Galaxies, 7, 42 [CrossRef] [Google Scholar]
- Iwasawa, K., Wilson, A., Fabian, A., & Young, A. 2003, MNRAS, 345, 369 [NASA ADS] [CrossRef] [Google Scholar]
- Izumi, T., Wada, K., Fukushige, R., Hamamura, S., & Kohno, K. 2018, ApJ, 867, 48 [NASA ADS] [CrossRef] [Google Scholar]
- Kamali, F., Henkel, C., Brunthaler, A., et al. 2017, A&A, 605, A84 [NASA ADS] [CrossRef] [EDP Sciences] [Google Scholar]
- Kenney, J. D. P. 1994, in Mass-Transfer Induced Activity in Galaxies, ed. I. Shlosman, 78 [CrossRef] [Google Scholar]
- Khachikyan, É. E., & Petrosyan, A. R. 1983, Astrophysics, 19, 138 [CrossRef] [Google Scholar]
- Krips, M., Neri, R., García-Burillo, S., et al. 2007, A&A, 468, L63 [NASA ADS] [CrossRef] [EDP Sciences] [Google Scholar]
- Krügel, E., Chini, R., & Steppe, H. 1990, A&A, 229, 17 [Google Scholar]
- Kukula, M. J., Pedlar, A., Baum, S. A., & O’Dea, C. P. 1995, MNRAS, 276, 1262 [Google Scholar]
- Kuno, N., Sato, N., Nakanishi, H., et al. 2008, Astrophys. Space Sci. Proc., 4, 170 [CrossRef] [Google Scholar]
- Kuo, C., Braatz, J., Condon, J., et al. 2010, ApJ, 727, 20 [Google Scholar]
- Levenson, N., Weaver, K., & Heckman, T. 2001, ApJ, 550, 230 [NASA ADS] [CrossRef] [Google Scholar]
- Li, J. G., & Seaquist, E. 1994, ApJ, 107, 1953 [NASA ADS] [CrossRef] [Google Scholar]
- Lu, N. Y., Hoffman, G. L., Groff, T., Roos, T., & Lamphier, C. 1993, ApJS, 88, 383 [NASA ADS] [CrossRef] [Google Scholar]
- Lynden-Bell, D., & Pringle, J. E. 1974, MNRAS, 168, 603 [NASA ADS] [CrossRef] [Google Scholar]
- Maiolino, R., Ruiz, M., Rieke, G. H., & Papadopoulos, P. 1997, ApJ, 485, 552 [NASA ADS] [CrossRef] [Google Scholar]
- Malkan, M. A., Gorjian, V., & Tam, R. 1998, ApJS, 117, 25 [NASA ADS] [CrossRef] [Google Scholar]
- Marinucci, A., Bianchi, S., Nicastro, F., Matt, G., & Goulding, A. D. 2012, ApJ, 748, 130 [NASA ADS] [CrossRef] [Google Scholar]
- Márquez, I., Durret, F., González Delgado, R. M., et al. 1999, A&AS, 140, 1 [NASA ADS] [CrossRef] [EDP Sciences] [Google Scholar]
- Martini, P., Regan, M. W., Mulchaey, J. S., & Pogge, R. W. 2003, ApJS, 146, 353 [NASA ADS] [CrossRef] [Google Scholar]
- Mason, R. E., Rodriguez-Ardila, A., Martins, L., et al. 2015, ApJS, 217, 13 [NASA ADS] [CrossRef] [Google Scholar]
- Mazzalay, X., Maciejewski, W., Erwin, P., et al. 2014, MNRAS, 438, 2036 [NASA ADS] [CrossRef] [Google Scholar]
- Mazzarella, J. M., & Boroson, T. A. 1993, ApJS, 85, 27 [Google Scholar]
- Merkulova, O., Karataeva, G., Yakovleva, V., & Burenkov, A. 2012, Astron. Lett., 38, 290 [CrossRef] [Google Scholar]
- Miller, J. M., Kammoun, E., Ludlam, R. M., et al. 2019, ApJ, 884, 106 [CrossRef] [Google Scholar]
- Mirabel, I., & Wilson, A. 1984, ApJ, 277, 92 [NASA ADS] [CrossRef] [Google Scholar]
- Moiseev, A. V., Valdés, J., & Chavushyan, V. 2004, A&A, 421, 433 [NASA ADS] [CrossRef] [EDP Sciences] [Google Scholar]
- Morganti, R., Oosterloo, T., Oonk, J. B. R., Frieswijk, W., & Tadhunter, C. 2015, A&A, 580, A1 [NASA ADS] [CrossRef] [EDP Sciences] [Google Scholar]
- Mulchaey, J. S., Wilson, A. S., & Tsvetanov, Z. 1996a, ApJ, 467, 197 [NASA ADS] [CrossRef] [Google Scholar]
- Mulchaey, J. S., Wilson, A. S., & Tsvetanov, Z. 1996b, ApJS, 102, 309 [NASA ADS] [CrossRef] [Google Scholar]
- Müller-Sánchez, F., Hicks, E., Malkan, M., et al. 2018, ApJ, 858, 48 [CrossRef] [Google Scholar]
- Mundell, C., Ferruit, P., Nagar, N., & Wilson, A. 2009, ApJ, 703, 802 [NASA ADS] [CrossRef] [Google Scholar]
- Muñoz Marín, V., Storchi-Bergmann, T., Delgado, R. G., et al. 2009, MNRAS, 399, 842 [NASA ADS] [CrossRef] [Google Scholar]
- Nagar, N. M., Wilson, A. S., Mulchaey, J. S., & Gallimore, J. F. 1999, ApJS, 120, 209 [NASA ADS] [CrossRef] [Google Scholar]
- Nyland, K., Young, L. M., Wrobel, J. M., et al. 2016, MNRAS, 458, 2221 [NASA ADS] [CrossRef] [Google Scholar]
- Oosterloo, T., & van Gorkom, J. 2005, A&A, 437, L19 [NASA ADS] [CrossRef] [EDP Sciences] [Google Scholar]
- Osterbrock, D. E., & Martel, A. 1993, ApJ, 414, 552 [Google Scholar]
- Osterbrock, D. E., & Pogge, R. W. 1985, ApJ, 297, 166 [NASA ADS] [CrossRef] [Google Scholar]
- Pappalardo, C., Bianchi, S., Corbelli, E., et al. 2012, A&A, 545, A75 [NASA ADS] [CrossRef] [EDP Sciences] [Google Scholar]
- Petitpas, G. R., & Wilson, C. D. 2002, ApJ, 575, 814 [NASA ADS] [CrossRef] [Google Scholar]
- Petitpas, G. R., & Wilson, C. D. 2003, ApJ, 587, 649 [NASA ADS] [CrossRef] [Google Scholar]
- Pringle, J. E. 1981, ARA&A, 19, 137 [NASA ADS] [CrossRef] [Google Scholar]
- Ramos Almeida, C., García, A. P., & Acosta-Pulido, J. A. 2009, ApJ, 694, 1379 [NASA ADS] [CrossRef] [Google Scholar]
- Ramos Almeida, C., Alonso-Herrero, A., Esquej, P., et al. 2014, MNRAS, 445, 1130 [NASA ADS] [CrossRef] [Google Scholar]
- Ricci, C., Trakhtenbrot, B., Koss, M. J., et al. 2017, ApJS, 233, 17 [NASA ADS] [CrossRef] [Google Scholar]
- Riffel, R. A., & Storchi-Bergmann, T. 2011, MNRAS, 411, 469 [NASA ADS] [CrossRef] [Google Scholar]
- Riffel, R. A., Storchi-Bergmann, T., Riffel, R., et al. 2017, MNRAS, 470, 992 [CrossRef] [Google Scholar]
- Rosario, D. J., Togi, A., Burtscher, L., et al. 2019, ApJ, 875, L8 [Google Scholar]
- Sakamoto, K., Okumura, S. K., Ishizuki, S., & Scoville, N. 1999, ApJS, 124, 403 [NASA ADS] [CrossRef] [Google Scholar]
- Salak, D., Nakai, N., Hatakeyama, T., & Miyamoto, Y. 2016, ApJ, 823, 68 [NASA ADS] [CrossRef] [Google Scholar]
- Sani, E., Davies, R., Sternberg, A., et al. 2012, MNRAS, 424, 1963 [NASA ADS] [CrossRef] [Google Scholar]
- Schinnerer, E., Eckart, A., & Tacconi, L. J. 2000a, ApJ, 533, 826 [NASA ADS] [CrossRef] [Google Scholar]
- Schinnerer, E., Eckart, A., Tacconi, L., Genzel, R., & Downes, D. 2000b, ApJ, 533, 850 [NASA ADS] [CrossRef] [Google Scholar]
- Schmitt, H. R., Donley, J. L., Antonucci, R., Hutchings, J., & Kinney, A. 2003, ApJS, 148, 327 [NASA ADS] [CrossRef] [Google Scholar]
- Schneider, P. 2007, Extragalactic Astronomy and Cosmology an Introduction (Springer Science & Business Media) [Google Scholar]
- Schnorr-Müller, A., Storchi-Bergmann, T., Nagar, N. M., & Ferrari, F. 2014, MNRAS, 438, 3322 [NASA ADS] [CrossRef] [Google Scholar]
- Schönell, A. J., Riffel, R. A., Storchi-Bergmann, T., & Winge, C. 2014, MNRAS, 445, 414 [NASA ADS] [CrossRef] [Google Scholar]
- Sheth, K., Vogel, S. N., Regan, M. W., et al. 2002, AJ, 124, 2581 [NASA ADS] [CrossRef] [Google Scholar]
- Shlosman, I., Frank, J., & Begelman, M. C. 1989, Nature, 338, 45 [NASA ADS] [CrossRef] [Google Scholar]
- Slater, R., Nagar, N. M., Schnorr-Müller, A., et al. 2019, A&A, 621, A83 [NASA ADS] [CrossRef] [EDP Sciences] [Google Scholar]
- Smirnova, A., Moiseev, A., & Afanasiev, V. 2010, MNRAS, 408, 400 [CrossRef] [Google Scholar]
- Tacconi, L. J., Neri, R., Genzel, R., et al. 2013, ApJ, 768, 74 [Google Scholar]
- Taniguchi, Y., Kameya, O., Nakai, N., & Kawara, K. 1990, ApJ, 358, 132 [NASA ADS] [CrossRef] [Google Scholar]
- Thean, A., Gillibrand, T., Pedlar, A., & Kukula, M. 2001, MNRAS, 327, 369 [CrossRef] [Google Scholar]
- Thomas, H., Dunne, L., Clemens, M., et al. 2002, MNRAS, 331, 853 [NASA ADS] [CrossRef] [Google Scholar]
- Ueda, J., Iono, D., Yun, M. S., et al. 2014, ApJS, 214, 1 [NASA ADS] [CrossRef] [Google Scholar]
- Ulvestad, J. S., & Wilson, A. S. 1989, ApJ, 343, 659 [NASA ADS] [CrossRef] [Google Scholar]
- van der Kruit, P. C., & Allen, R. J. 1978, ARA&A, 16, 103 [NASA ADS] [CrossRef] [Google Scholar]
- van der Laan, T. P. R., Schinnerer, E., Boone, F., et al. 2011, A&A, 529, A45 [NASA ADS] [CrossRef] [EDP Sciences] [Google Scholar]
- Van Driel, W., & Buta, R. 1991, A&A, 245, 7 [Google Scholar]
- Van Driel, W., Augarde, R., Bottinelli, L., et al. 1992, A&A, 259, 71 [Google Scholar]
- Vargas, C. J., Walterbos, R. A. M., Rand, R. J., et al. 2019, ApJ, 881, 26 [CrossRef] [Google Scholar]
- Veilleux, S., Bland-Hawthorn, J., & Cecil, G. 1999a, ApJ, 118, 2108 [NASA ADS] [CrossRef] [Google Scholar]
- Veilleux, S., Bland-Hawthorn, J., Cecil, G., Tully, R. B., & Miller, S. T. 1999b, ApJ, 520, 111 [NASA ADS] [CrossRef] [Google Scholar]
- Verdugo, C., Combes, F., Dasyra, K., Salomé, P., & Braine, J. 2015, A&A, 582, A6 [NASA ADS] [CrossRef] [EDP Sciences] [Google Scholar]
- Vila-Vilaró, B., Taniguchi, Y., & Nakai, N. 1998, ApJ, 116, 1553 [NASA ADS] [CrossRef] [Google Scholar]
- Vollmer, B., & Huchtmeier, W. 2003, A&A, 406, 427 [NASA ADS] [CrossRef] [EDP Sciences] [Google Scholar]
- Wada, K. 2012, ApJ, 758, 66 [NASA ADS] [CrossRef] [Google Scholar]
- Williamson, D., Venanzi, M., & Hönig, S. 2019, ApJ, 876, 137 [NASA ADS] [CrossRef] [Google Scholar]
- Yoshida, M., Yagi, M., Okamura, S., et al. 2002, ApJ, 567, 118 [NASA ADS] [CrossRef] [Google Scholar]
- Young, L. M., Bureau, M., Davis, T. A., et al. 2011, MNRAS, 414, 940 [NASA ADS] [CrossRef] [Google Scholar]
- Young, L. M., Scott, N., Serra, P., et al. 2014, MNRAS, 444, 3408 [NASA ADS] [CrossRef] [Google Scholar]
All Tables
CO(2-1) integrated fluxes and derived molecular gas masses in several apertures.
All Figures
|
Fig. 1. Mrk 1066. Left: HST/WFPC2 F606W (∼ V band) image. Right: NOEMA CO(2-1) integrated intensity map (0th moment) with a 3σ clipping applied on each pixel for the channels with line emission in the continuum-free line cube (see Sect. 3). Masked pixels are shown in grey. The green dashed lines represent the edges of the ionization cone, and the dashed yellow line the cone axis. The brown solid lines are the PA of the major axis of the main bars. The parameters and references for both the bicone and the main bar are listed in Table 2. In both figures, north is up and east to the left. The hatched ellipse in the bottom-left corner of the right panel is the beam size (see Table 3). The CO(2-1) integrated intensity contours are as follows: 0.5 (∼4σ, σ = 0.13 Jy km s−1 beam−1) and from 1 to 12 Jy km s−1 beam−1, in steps of 1.0 Jy km s−1 beam−1. |
| In the text | |
|
Fig. 2. Mrk 1066. Panel a: CO(2-1) integrated intensity contours (as in Fig. 1) in blue overlaid on the V − H color map. Light colors indicate low extinction and dark colors high extinction. Panel b: 3DBAROLO CO(2-1) observed velocity field. Panel c: 3DBAROLO velocity model. Velocity contours in b and c panels are from 3540 to 3800 km s−1 in steps of 20 km s−1. Panel d: 1.3 mm continuum map with the contours at −6σ, −3σ (white dashed line), 3σ, 6σ, 9σ, 12σ, 15σ, and 18σ (white solid line), and σ = 41 μJy beam−1. Panel e: residual velocity map. Contours are from −50 to 50 km s−1 in steps of 10 km s−1. Purple stars and ellipses mark the regions from which we extracted spectra (see Fig. 3). Panel f: 3DBAROLO CO(2-1)-observed velocity dispersion map. Contours are in steps of 10 km s−1, starting at 10 km s−1. Ellipses in the bottom corners are the NOEMA-synthesized beam (see Table 3), and the red or black dashed (dotted) line is the major (minor) kinematic axis derived from the 3DBAROLO fit (see Table 5). The white star marks the 1.3 mm continuum peak. |
| In the text | |
|
Fig. 3. CO(2-1) spectra from the two nuclear regions of Mrk 1066 integrated over an area equal to the beam. The Gaussians we fit to identify the different kinematic components are the color dash-dotted lines and their sum the black line. The horizontal orange dashed line is the 5σ level, where σ is the standard deviation in the channels outside of the spectral window (vertical gray dashed lines). We also show the modeled velocity (vertical red dashed line) for the rotating disk obtained with 3DBAROLO for the central pixel of the area (purple stars in Fig. 2, panel e). Relative coordinates in pc from the AGN for the central pixel of the apertures are given in the top left boxes. |
| In the text | |
|
Fig. 4. Position-velocity diagrams taken along the kinematic major (PA∼302°) and minor (PA∼212°) axes of Mrk 1066 extracted with 3DBAROLO. Color images and the blue contours 1 (3σ, see Table 3), 2, 4, 8, and 16 times 5.1 × 10−3 Jy beam−1 represent the observed CO(2-1) line emission. Red contours depict the 3DBAROLO rotating disk model and their values are the same as the blue ones. Magenta stars represent the velocities in each ring of the model, while the cyan dashed line is the best fit of these velocities to the parametric rotational curve given by Eq. (1). The black dotted lines (bottom panel) enclose the emission that shows noncircular motions approximately. |
| In the text | |
|
Fig. 5. Same as Fig. 1 but for NGC 2273. CO(2-1) integrated-intensity contours: 0.5 (5σ, σ = 0.1 Jy km s−1 beam−1) and from 1.5 to 9 Jy km s−1 beam−1, in steps of 1.5 Jy km s−1 beam−1. |
| In the text | |
|
Fig. 6. Same as Fig. 2 but for NGC 2273. Velocity contours (b and c panels) are from 1645 to 2015 km s−1 in steps of 20 km s−1. The continuum contours are −3σ (white dashed line), 3σ, 6σ and 9σ (solid lines) with σ = 46 μJy beam−1. The residual velocity contours are from −50 to 50 km s−1 in steps of 10 km s−1. The velocity dispersion contours are in steps of 10 km s−1 starting at 10 km s−1. |
| In the text | |
|
Fig. 7. Position-velocity diagrams taken along the kinematic major (PA ∼ 54°) and minor (PA ∼144°) axes of NGC 2273 extracted with 3DBAROLO. Contours are 1 (3σ, see Table 3), 2, 4, 8, and 16 times 4.2 × 10−3 Jy beam−1. Colors and lines as in Fig. 4. |
| In the text | |
|
Fig. 8. Same as Fig. 1 but for NGC 4253. CO(2-1) integrated-intensity contours: 0.3 (5σ, σ = 0.063 Jy km s−1 beam−1), 1.0 and from 1.5 to 9 Jy km s−1 beam−1, in steps of 1.5 Jy km s−1 beam−1. |
| In the text | |
|
Fig. 9. From top to bottom: 1.3 mm continuum image, the CO(2-1) integrated intensity contours overlaid on the V − H color map, the CO(2-1) observed mean velocity field, the 3DBAROLO velocity model, the residual velocity map (observed-model), and the CO(2-1) observed velocity dispersion map. Green dashed ellipses depicted in panel b are examples of x1 and x2 orbits induced by the main stellar bar assuming the parameters obtained by Alonso-Herrero et al. (1998) and a bar width equal to that of the nuclear region (2 |
| In the text | |
|
Fig. 10. Position-velocity diagrams taken along the kinematic major (PA ∼ 263°) and minor (PA ∼173°) axes of NGC 4253 extracted with 3DBAROLO. Contours are 1 (3σ, see Table 3), 2, 4, 8, 16, and 32 times 3.0 × 10−3 Jy beam−1. Colors and lines as in Fig. 4. |
| In the text | |
|
Fig. 11. Top and bottom panels: CO(2-1) extracted spectra of NGC 4253 (distances from the AGN are given in the top left or top right boxes of each panel). We extracted the spectra with an aperture equal to the beam size except for the first and last spectra, which are integrated on a circular aperture of radius 0 |
| In the text | |
|
Fig. 12. NGC 4388. Top: HST/WFC3/UVIS F814W (∼I band) image. Bottom: NOEMA CO(2-1) integrated intensity map (0th moment). CO(2-1) integrated intensity contours: σ = 0.28 Jy km s−1 beam−1, 1.0 (∼3.6σ) and from 1.5 to 7.5 Jy km s−1 beam−1, in steps of 1.5 Jy km s−1 beam−1. The star marks the assumed location of the AGN, which in this case corresponds to the 21 cm continuum peak from VLBI observations (Giroletti & Panessa 2009), since this is the only source in which we did not detect the 1.3 mm continuum (see text for futher details). Lines and other details as in Fig. 1. |
| In the text | |
|
Fig. 13. NGC 4388. From top to bottom: CO(2-1) integrated intensity contours overlaid on the I − H color map, CO(2-1) observed mean velocity field, velocity model, residual velocity map (observed-model), and CO(2-1) observed velocity dispersion map. The white star shows the adopted AGN position. The rest is as in Fig. 2. Contours: CO(2-1) integrated intensity contours are the same as in Fig. 1. Velocity contours (b and c panels) are from 2335 to 2700 km s−1 in steps of 20 km s−1. Residual velocity contours are from −200 to 200 km s−1 in steps of 30 km s−1. Velocity dispersion contours are in steps of 30 km s−1, starting at 30 km s−1. |
| In the text | |
|
Fig. 14. Position-velocity diagrams taken along the kinematic major (PA ∼ 88°) and minor (PA ∼178°) axes of NGC 4388 extracted with 3DBAROLO. Contours are 1 (∼3σ, see Table 3), 2, 4, and 8 times 1.0 × 10−2 Jy beam−1. Orange dashed lines (top panel) enclose the emission inside 1″ from the assumed nucleus which show noncircular motions. The rest is as in Fig. 4. |
| In the text | |
|
Fig. 15. Same as Fig. 1 but for NGC 7465. CO(2-1) integrated-intensity contours: 0.3 (∼4σ, σ = 0.076 Jy km s−1 beam−1) and from 0.5 to 3.0 Jy km s−1 beam−1, in steps of 0.5 Jy km s−1 beam−1. |
| In the text | |
|
Fig. 16. Same as Fig. 2, but for NGC 7465. Velocity contours in panels b and c are from 1860 to 2100 km s−1 in steps of 20 km s−1. Continuum contours are −3σ (white dashed line), 3σ and 6σ (white solid line) with σ = 30 μJy beam−1. The residual velocity contours are from −50 to 50 km s−1 in steps of 10 km s−1. The velocity dispersion contours are in steps of 10 km s−1, starting at 10 km s−1. |
| In the text | |
|
Fig. 17. Position-velocity diagrams taken along the kinematic major (PA ∼ 52°) and minor (PA ∼142°) axes of NGC 7465 extracted with 3DBAROLO. Contours are 1 (3σ, see Table 3), 2, 4, and 8 times 3.6 × 10−3 Jy beam−1. Dotted lines enclose the emission outside the inner 1″. Colors and lines as in Fig. 4. |
| In the text | |
Current usage metrics show cumulative count of Article Views (full-text article views including HTML views, PDF and ePub downloads, according to the available data) and Abstracts Views on Vision4Press platform.
Data correspond to usage on the plateform after 2015. The current usage metrics is available 48-96 hours after online publication and is updated daily on week days.
Initial download of the metrics may take a while.