Fig. 12.
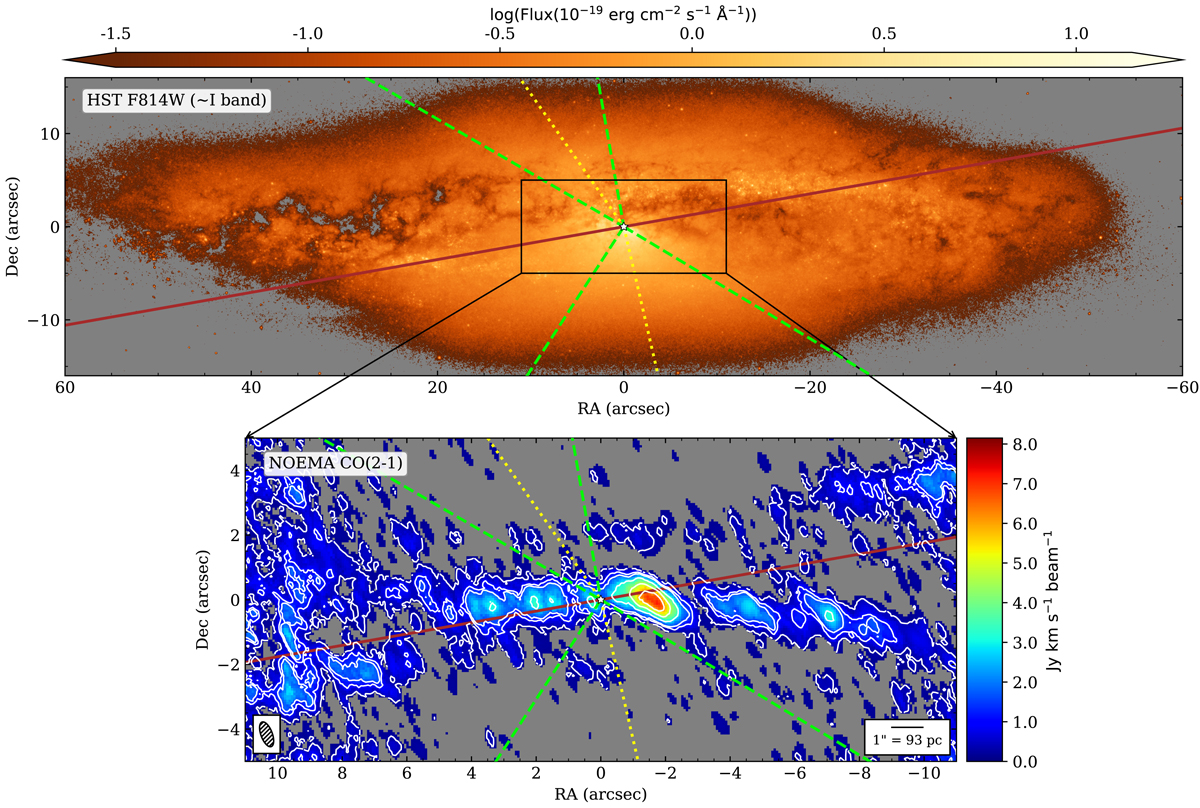
NGC 4388. Top: HST/WFC3/UVIS F814W (∼I band) image. Bottom: NOEMA CO(2-1) integrated intensity map (0th moment). CO(2-1) integrated intensity contours: σ = 0.28 Jy km s−1 beam−1, 1.0 (∼3.6σ) and from 1.5 to 7.5 Jy km s−1 beam−1, in steps of 1.5 Jy km s−1 beam−1. The star marks the assumed location of the AGN, which in this case corresponds to the 21 cm continuum peak from VLBI observations (Giroletti & Panessa 2009), since this is the only source in which we did not detect the 1.3 mm continuum (see text for futher details). Lines and other details as in Fig. 1.
Current usage metrics show cumulative count of Article Views (full-text article views including HTML views, PDF and ePub downloads, according to the available data) and Abstracts Views on Vision4Press platform.
Data correspond to usage on the plateform after 2015. The current usage metrics is available 48-96 hours after online publication and is updated daily on week days.
Initial download of the metrics may take a while.