Fig. 13.
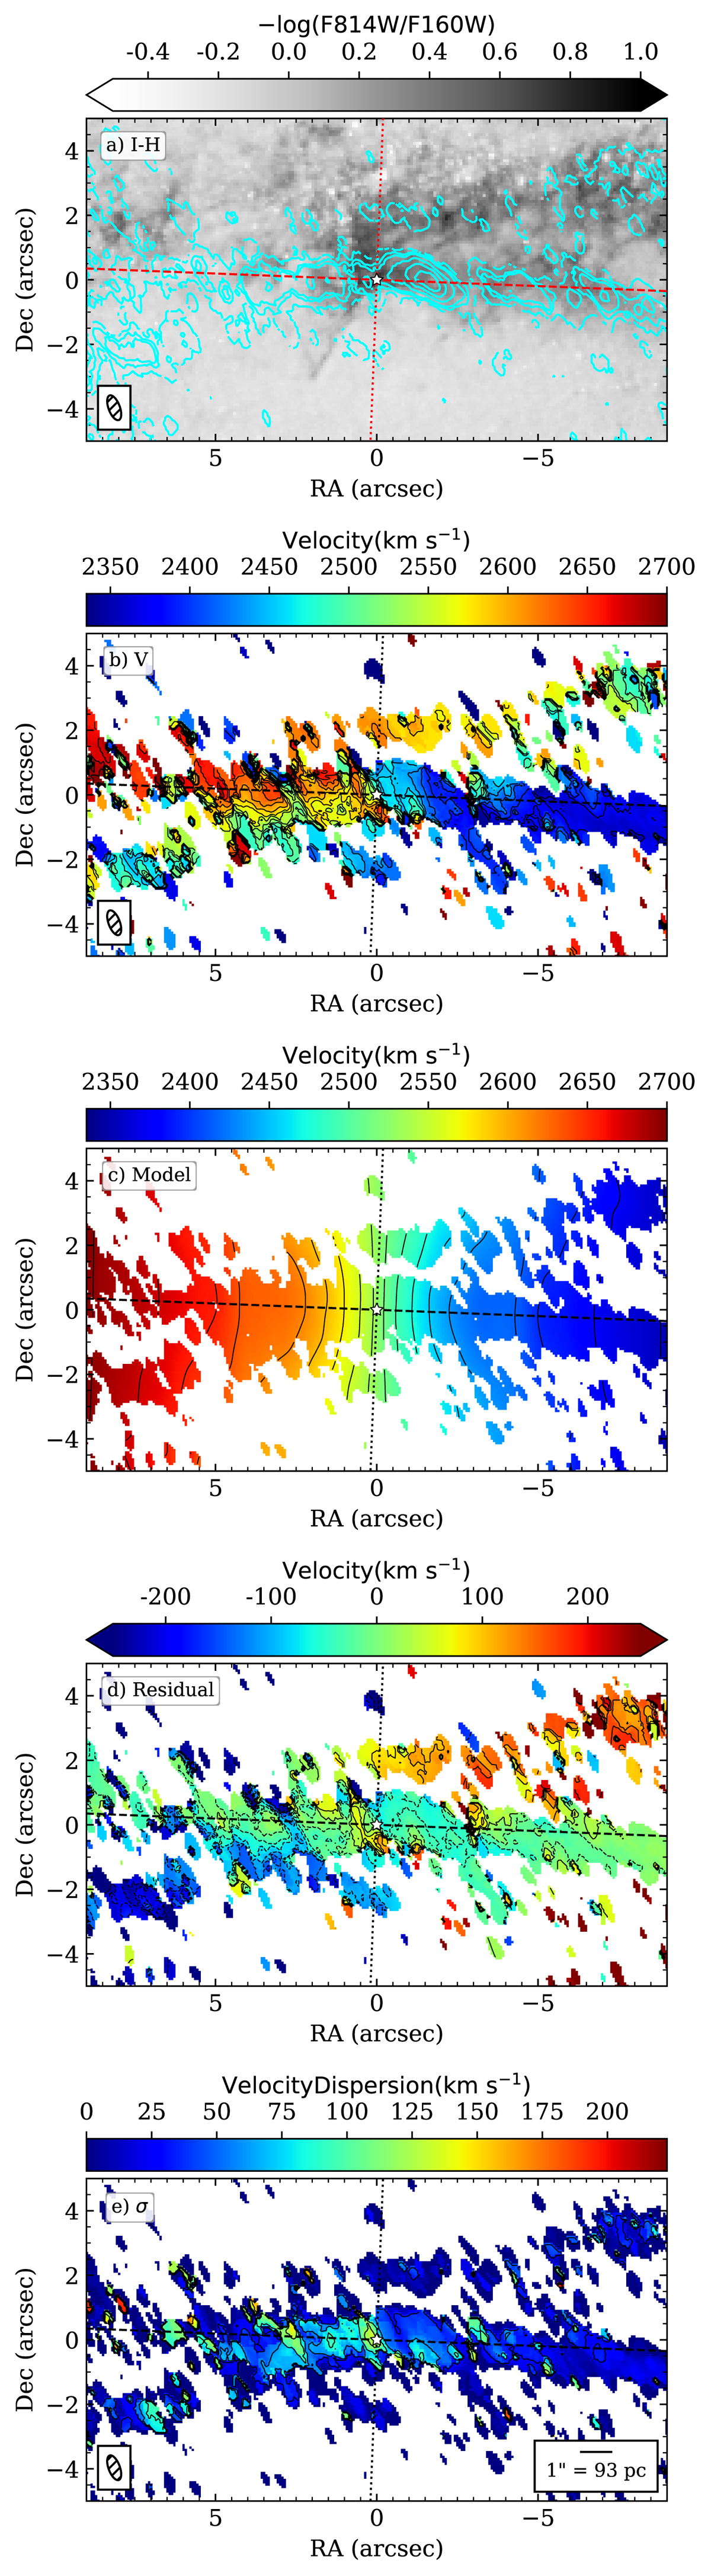
NGC 4388. From top to bottom: CO(2-1) integrated intensity contours overlaid on the I − H color map, CO(2-1) observed mean velocity field, velocity model, residual velocity map (observed-model), and CO(2-1) observed velocity dispersion map. The white star shows the adopted AGN position. The rest is as in Fig. 2. Contours: CO(2-1) integrated intensity contours are the same as in Fig. 1. Velocity contours (b and c panels) are from 2335 to 2700 km s−1 in steps of 20 km s−1. Residual velocity contours are from −200 to 200 km s−1 in steps of 30 km s−1. Velocity dispersion contours are in steps of 30 km s−1, starting at 30 km s−1.
Current usage metrics show cumulative count of Article Views (full-text article views including HTML views, PDF and ePub downloads, according to the available data) and Abstracts Views on Vision4Press platform.
Data correspond to usage on the plateform after 2015. The current usage metrics is available 48-96 hours after online publication and is updated daily on week days.
Initial download of the metrics may take a while.