Fig. 2.
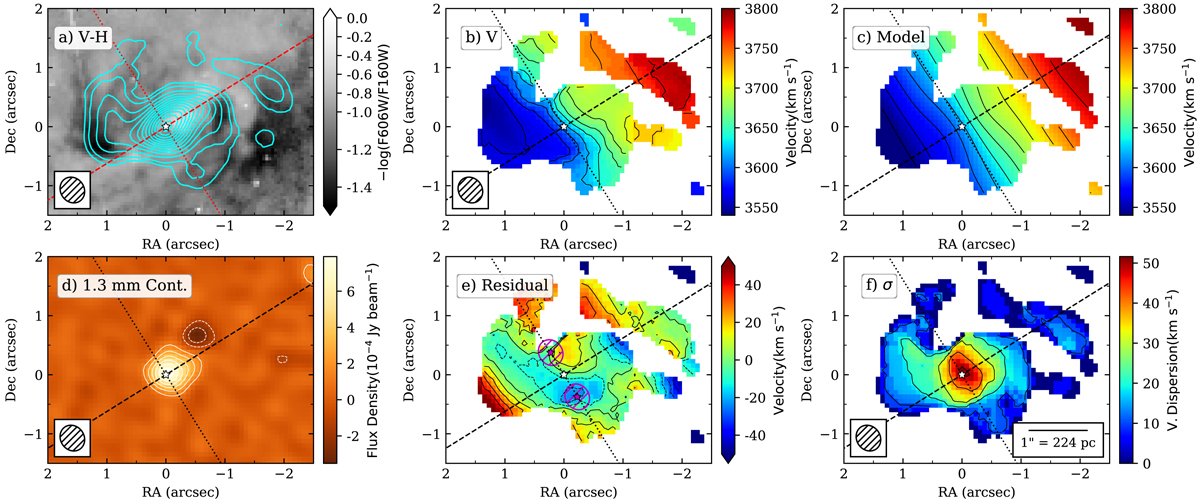
Mrk 1066. Panel a: CO(2-1) integrated intensity contours (as in Fig. 1) in blue overlaid on the V − H color map. Light colors indicate low extinction and dark colors high extinction. Panel b: 3DBAROLO CO(2-1) observed velocity field. Panel c: 3DBAROLO velocity model. Velocity contours in b and c panels are from 3540 to 3800 km s−1 in steps of 20 km s−1. Panel d: 1.3 mm continuum map with the contours at −6σ, −3σ (white dashed line), 3σ, 6σ, 9σ, 12σ, 15σ, and 18σ (white solid line), and σ = 41 μJy beam−1. Panel e: residual velocity map. Contours are from −50 to 50 km s−1 in steps of 10 km s−1. Purple stars and ellipses mark the regions from which we extracted spectra (see Fig. 3). Panel f: 3DBAROLO CO(2-1)-observed velocity dispersion map. Contours are in steps of 10 km s−1, starting at 10 km s−1. Ellipses in the bottom corners are the NOEMA-synthesized beam (see Table 3), and the red or black dashed (dotted) line is the major (minor) kinematic axis derived from the 3DBAROLO fit (see Table 5). The white star marks the 1.3 mm continuum peak.
Current usage metrics show cumulative count of Article Views (full-text article views including HTML views, PDF and ePub downloads, according to the available data) and Abstracts Views on Vision4Press platform.
Data correspond to usage on the plateform after 2015. The current usage metrics is available 48-96 hours after online publication and is updated daily on week days.
Initial download of the metrics may take a while.