Fig. 1.
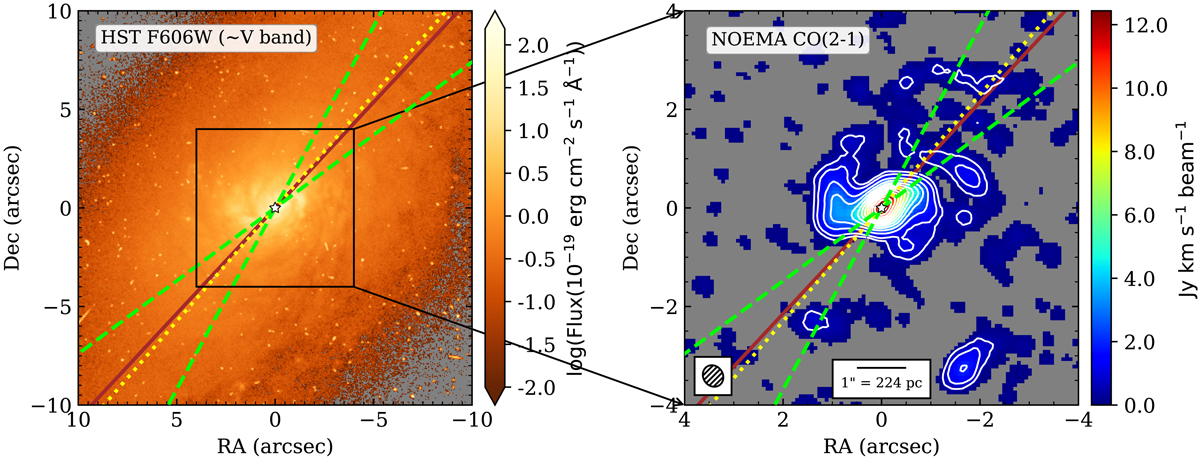
Mrk 1066. Left: HST/WFPC2 F606W (∼ V band) image. Right: NOEMA CO(2-1) integrated intensity map (0th moment) with a 3σ clipping applied on each pixel for the channels with line emission in the continuum-free line cube (see Sect. 3). Masked pixels are shown in grey. The green dashed lines represent the edges of the ionization cone, and the dashed yellow line the cone axis. The brown solid lines are the PA of the major axis of the main bars. The parameters and references for both the bicone and the main bar are listed in Table 2. In both figures, north is up and east to the left. The hatched ellipse in the bottom-left corner of the right panel is the beam size (see Table 3). The CO(2-1) integrated intensity contours are as follows: 0.5 (∼4σ, σ = 0.13 Jy km s−1 beam−1) and from 1 to 12 Jy km s−1 beam−1, in steps of 1.0 Jy km s−1 beam−1.
Current usage metrics show cumulative count of Article Views (full-text article views including HTML views, PDF and ePub downloads, according to the available data) and Abstracts Views on Vision4Press platform.
Data correspond to usage on the plateform after 2015. The current usage metrics is available 48-96 hours after online publication and is updated daily on week days.
Initial download of the metrics may take a while.