Fig. 11.
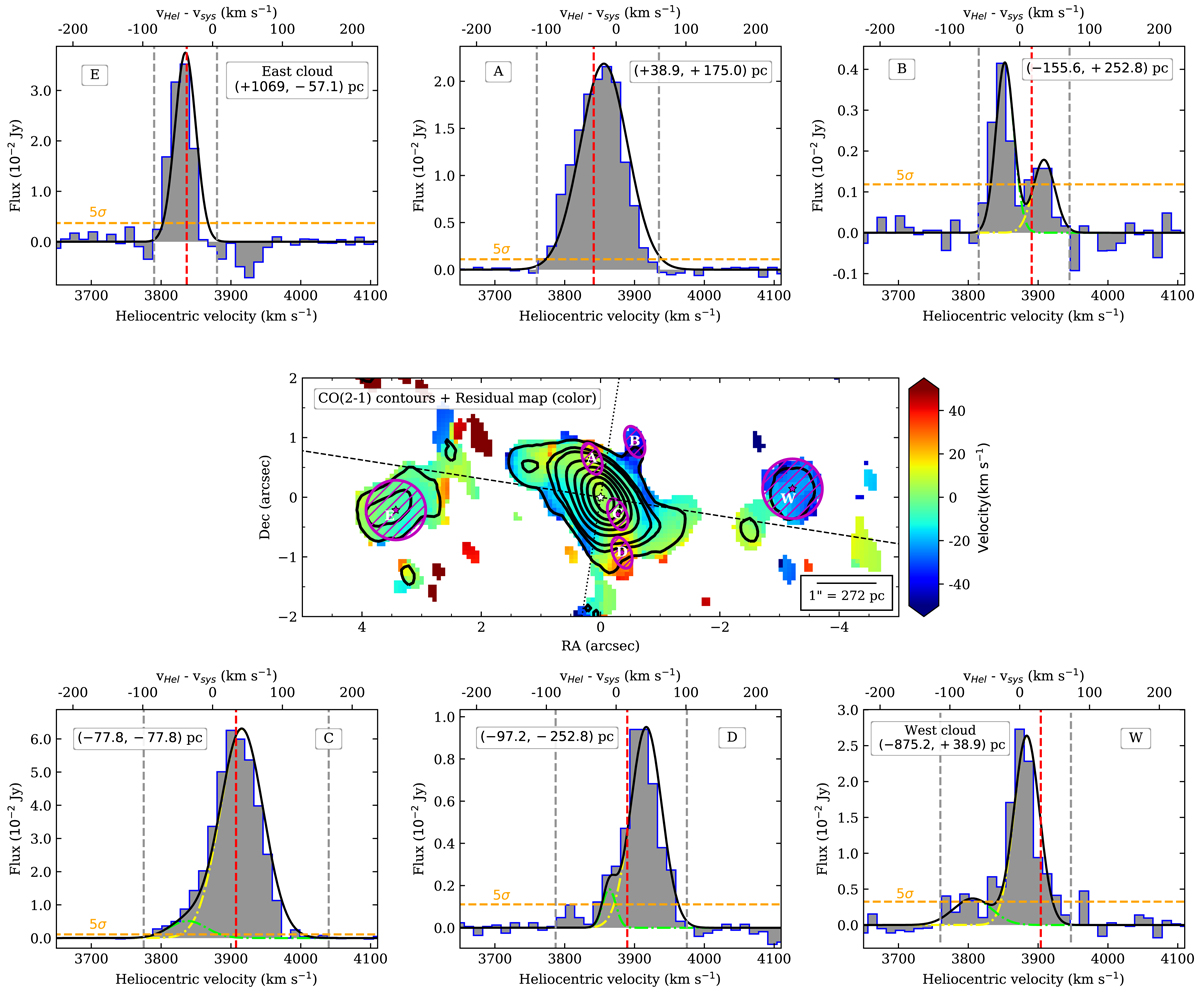
Top and bottom panels: CO(2-1) extracted spectra of NGC 4253 (distances from the AGN are given in the top left or top right boxes of each panel). We extracted the spectra with an aperture equal to the beam size except for the first and last spectra, which are integrated on a circular aperture of radius 0![]() 5. Middle: CO(2-1) integrated intensity contours overlaid on the mean velocity residual map. Lines of the spectra are as in Fig. 3 and CO(2-1) integrated intensity contours are as in Fig. 8.
5. Middle: CO(2-1) integrated intensity contours overlaid on the mean velocity residual map. Lines of the spectra are as in Fig. 3 and CO(2-1) integrated intensity contours are as in Fig. 8.
Current usage metrics show cumulative count of Article Views (full-text article views including HTML views, PDF and ePub downloads, according to the available data) and Abstracts Views on Vision4Press platform.
Data correspond to usage on the plateform after 2015. The current usage metrics is available 48-96 hours after online publication and is updated daily on week days.
Initial download of the metrics may take a while.