Fig. 3.
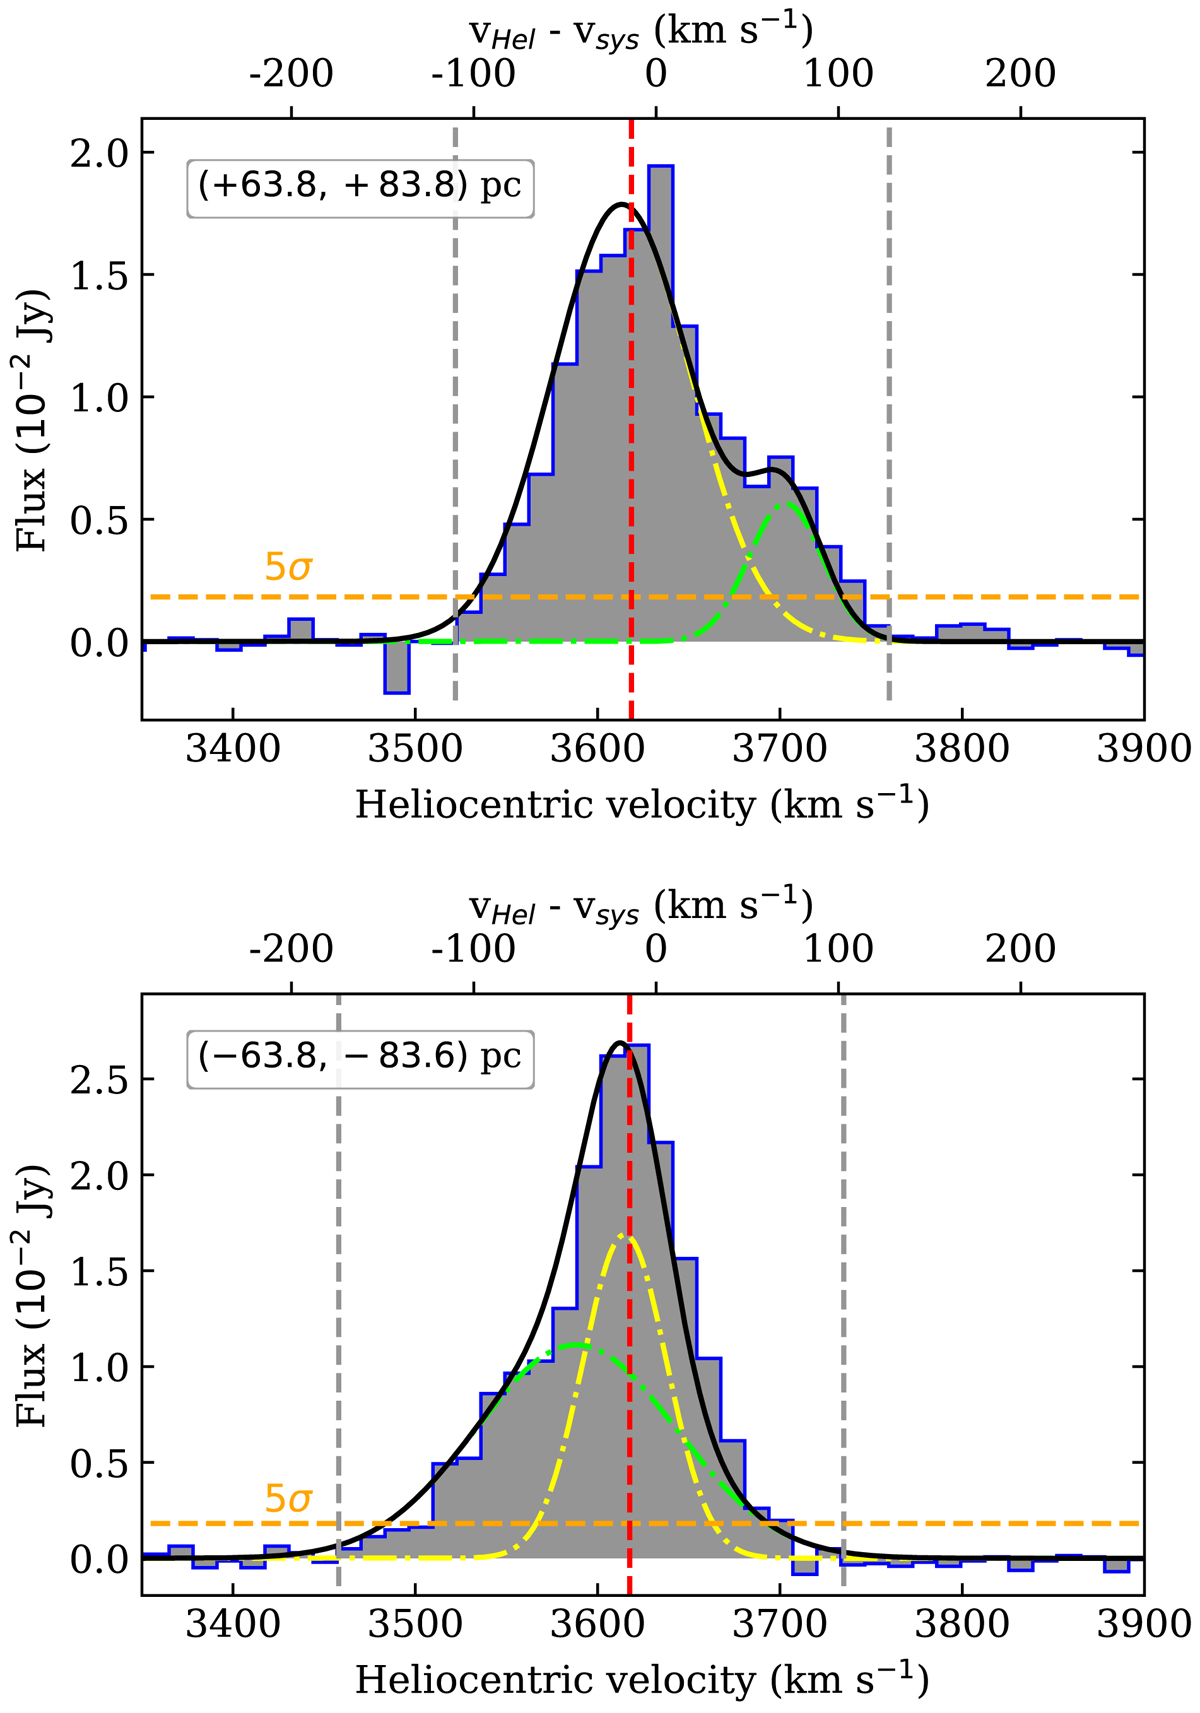
CO(2-1) spectra from the two nuclear regions of Mrk 1066 integrated over an area equal to the beam. The Gaussians we fit to identify the different kinematic components are the color dash-dotted lines and their sum the black line. The horizontal orange dashed line is the 5σ level, where σ is the standard deviation in the channels outside of the spectral window (vertical gray dashed lines). We also show the modeled velocity (vertical red dashed line) for the rotating disk obtained with 3DBAROLO for the central pixel of the area (purple stars in Fig. 2, panel e). Relative coordinates in pc from the AGN for the central pixel of the apertures are given in the top left boxes.
Current usage metrics show cumulative count of Article Views (full-text article views including HTML views, PDF and ePub downloads, according to the available data) and Abstracts Views on Vision4Press platform.
Data correspond to usage on the plateform after 2015. The current usage metrics is available 48-96 hours after online publication and is updated daily on week days.
Initial download of the metrics may take a while.