Fig. 4.
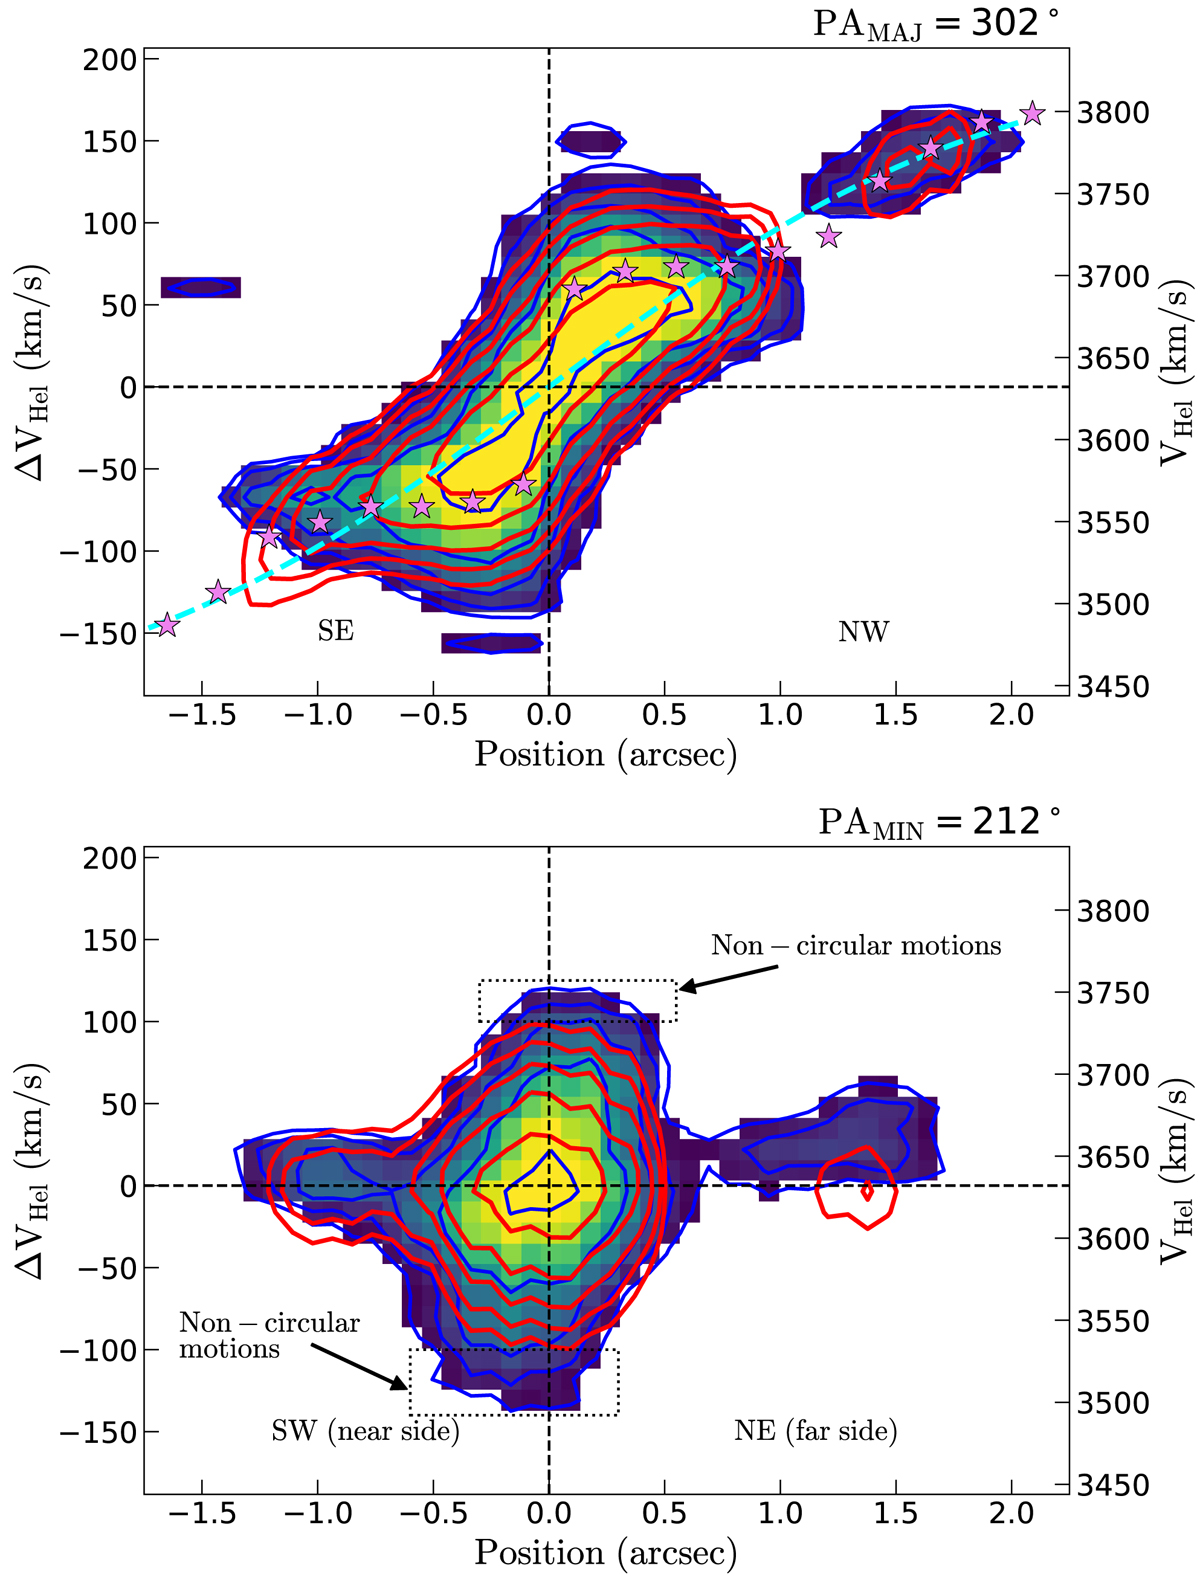
Position-velocity diagrams taken along the kinematic major (PA∼302°) and minor (PA∼212°) axes of Mrk 1066 extracted with 3DBAROLO. Color images and the blue contours 1 (3σ, see Table 3), 2, 4, 8, and 16 times 5.1 × 10−3 Jy beam−1 represent the observed CO(2-1) line emission. Red contours depict the 3DBAROLO rotating disk model and their values are the same as the blue ones. Magenta stars represent the velocities in each ring of the model, while the cyan dashed line is the best fit of these velocities to the parametric rotational curve given by Eq. (1). The black dotted lines (bottom panel) enclose the emission that shows noncircular motions approximately.
Current usage metrics show cumulative count of Article Views (full-text article views including HTML views, PDF and ePub downloads, according to the available data) and Abstracts Views on Vision4Press platform.
Data correspond to usage on the plateform after 2015. The current usage metrics is available 48-96 hours after online publication and is updated daily on week days.
Initial download of the metrics may take a while.