Fig. 9.
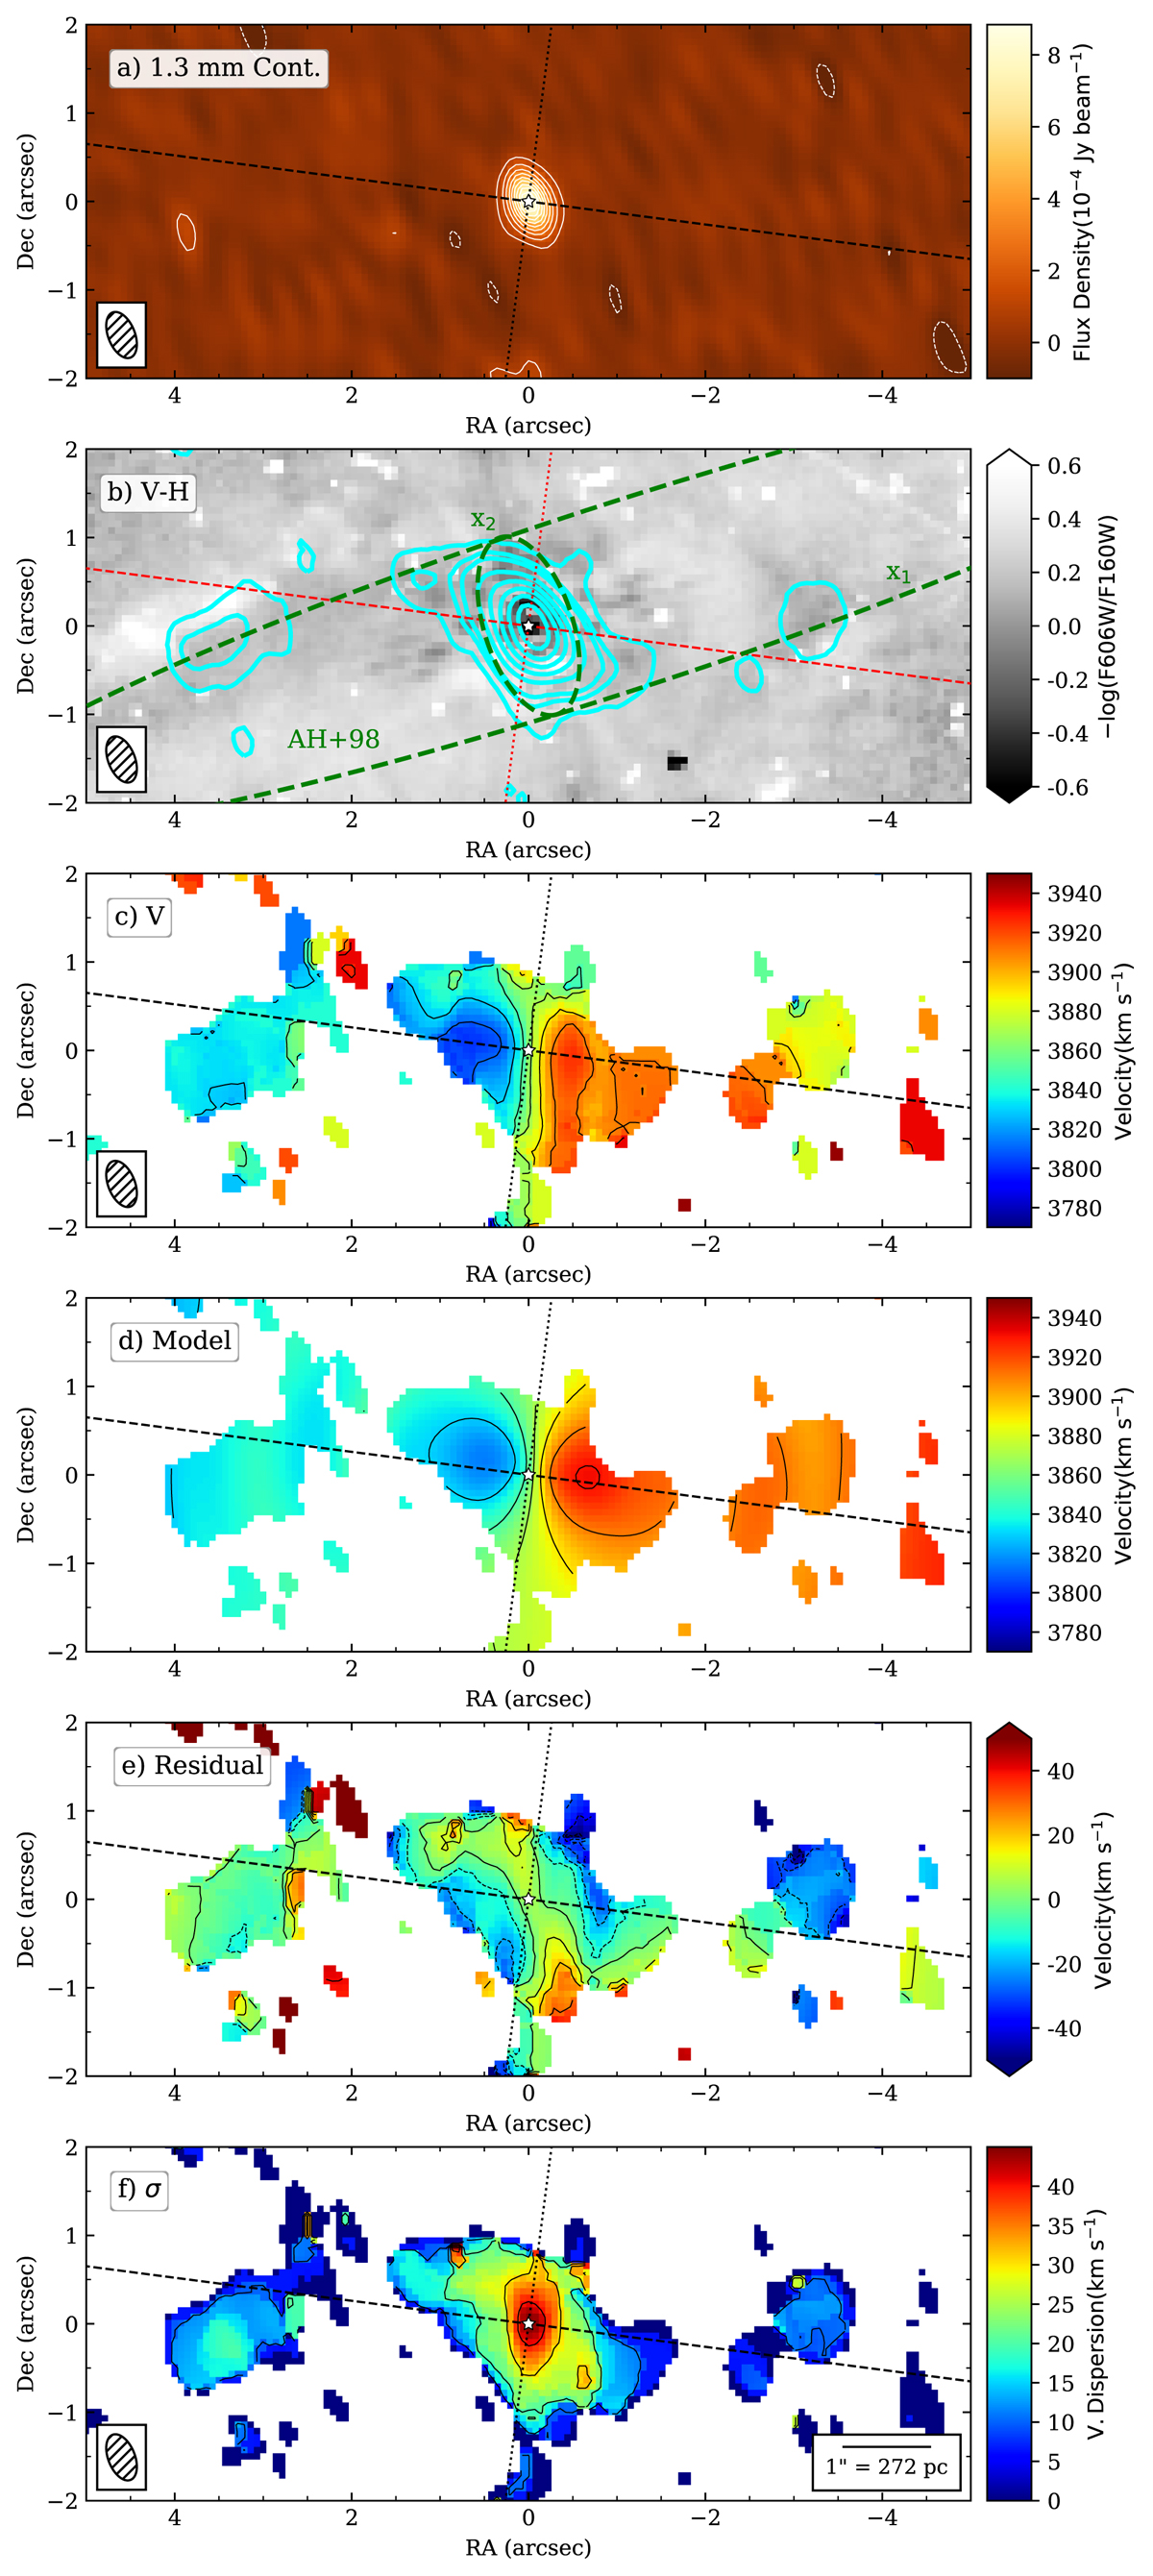
From top to bottom: 1.3 mm continuum image, the CO(2-1) integrated intensity contours overlaid on the V − H color map, the CO(2-1) observed mean velocity field, the 3DBAROLO velocity model, the residual velocity map (observed-model), and the CO(2-1) observed velocity dispersion map. Green dashed ellipses depicted in panel b are examples of x1 and x2 orbits induced by the main stellar bar assuming the parameters obtained by Alonso-Herrero et al. (1998) and a bar width equal to that of the nuclear region (2![]() 1). Integrated spectra extracted for this galaxy are shown in Fig. 11. The rest is as in Fig. 2. Continuum contours are −3σ (white dashed line) and 3σ to 33σ, in steps of 3σ (white solid line), with σ = 28 μJy beam−1. Velocity contours (b and c panels) are from 3770 to 3950 km s−1 in steps of 20 km s−1. The residual velocity contours are from −40 to 40 km s−1 in steps of 10 km s−1. The velocity dispersion contours are in steps of 10 km s−1, starting at 10 km s−1.
1). Integrated spectra extracted for this galaxy are shown in Fig. 11. The rest is as in Fig. 2. Continuum contours are −3σ (white dashed line) and 3σ to 33σ, in steps of 3σ (white solid line), with σ = 28 μJy beam−1. Velocity contours (b and c panels) are from 3770 to 3950 km s−1 in steps of 20 km s−1. The residual velocity contours are from −40 to 40 km s−1 in steps of 10 km s−1. The velocity dispersion contours are in steps of 10 km s−1, starting at 10 km s−1.
Current usage metrics show cumulative count of Article Views (full-text article views including HTML views, PDF and ePub downloads, according to the available data) and Abstracts Views on Vision4Press platform.
Data correspond to usage on the plateform after 2015. The current usage metrics is available 48-96 hours after online publication and is updated daily on week days.
Initial download of the metrics may take a while.