| Issue |
A&A
Volume 642, October 2020
|
|
|---|---|---|
| Article Number | A140 | |
| Number of page(s) | 17 | |
| Section | Planets and planetary systems | |
| DOI | https://doi.org/10.1051/0004-6361/202038458 | |
| Published online | 13 October 2020 | |
Giant planet formation at the pressure maxima of protoplanetary disks
II. A hybrid accretion scenario
1
Grupo de Astrofísica Planetaria, Instituto de Astrofísica de La Plata, CCT La Plata-CONICET-UNLP,
Paseo del Bosque s/n (1900),
La Plata,
Argentina
e-mail: This email address is being protected from spambots. You need JavaScript enabled to view it.
2
Instituto de Astrofísica, Pontificia Universidad Católica de Chile,
Santiago,
Chile
3
Núcleo Milenio Formación Planetaria (NPF), Pontificia Universidad Católica,
Chile
4
Department of Astronomy, Eötvös Loránd University,
1117
Budapest,
Pázmány Péter sétány 1/A,
Hungary
e-mail: This email address is being protected from spambots. You need JavaScript enabled to view it.
5
Konkoly Observatory, Research Centre for Astronomy and Earth Sciences,
1121
Budapest,
Konkoly Thege Miklós út 15-17, Hungary
6
International Space Science Institute,
Hallerstrasse 6,
3012
Bern, Switzerland
7
Facultad de Ciencias Astronómicas y Geofísicas, Universidad Nacional de La Plata,
Paseo del Bosque s/n (1900),
La Plata, Argentina
Received:
21
May
2020
Accepted:
9
August
2020
Abstract
Context. Recent high-resolution observations of protoplanetary disks have revealed ring-like structures that can be associated to pressure maxima. Pressure maxima are known to be dust collectors and planet migration traps. The great majority of planet formation studies are based either on the pebble accretion model or on the planetesimal accretion model. However, recent studies proposed hybrid accretion of pebbles and planetesimals as a possible formation mechanism for Jupiter.
Aims. We aim to study the full process of planet formation consisting of dust evolution, planetesimal formation, and planet growth at a pressure maximum in a protoplanetary disk.
Methods. We compute, through numerical simulations, the gas and dust evolution in a protoplanetary disk, including dust growth, fragmentation, radial drift, and particle accumulation at a pressure maximum. The pressure maximum appears due to an assumed viscosity transition at the water ice line. We also consider the formation of planetesimals by streaming instability and the formation of a moon-size embryo that grows into a giant planet by the hybrid accretion of pebbles and planetesimals, all within the pressure maximum.
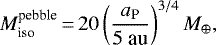
Results. We find that the pressure maximum is an efficient collector of dust drifting inwards. The condition of planetesimal formation by streaming instability is fulfilled due to the large amount of dust accumulated at the pressure bump. Subsequently, a massive core is quickly formed (in ~104 yr) by the accretion of pebbles. After the pebble isolation mass is reached, the growth of the core slowly continues by the accretion of planetesimals. The energy released by planetesimal accretion delays the onset of runaway gas accretion, allowing a gas giant to form after ~1 Myr of disk evolution. The pressure maximum also acts as a migration trap.
Conclusions. Pressure maxima generated by a viscosity transition at the water ice line are preferential locations for dust traps, planetesimal formation by streaming instability, and planet migration traps. All these conditions allow the fast formation of a giant planet by the hybrid accretion of pebbles and planetesimals.
Key words: planets and satellites: formation / planets and satellites: gaseous planets / protoplanetary disks
© ESO 2020
1 Introduction
Planet formation is one of the main topics of modern astronomy, especially since the discovery of the first exoplanet in orbit around a solar-type star (Mayor & Queloz 1995). Although our knowledge of planet formation has significantly increased in recent decades, some fundamental questions remain unanswered. To date, there are two main planet formation theories: the core accretion mechanism (Safronov 1969; Mizuno 1980; Bodenheimer & Pollack 1986) and the gravitational instability model (Boss 1997). Core accretion is currently the most accepted paradigm, mainly because it naturally explains the diversity of observed planets (see Benz et al. 2014; Venturini et al. 2020a, and reference therein). Two main approaches have been devised to study the core accretion mechanism: the classical planetesimal accretion model (Pollack et al. 1996; Alibert et al. 2005, 2013; Fortier et al. 2007, 2009; Guilera et al. 2010, 2014; Ormel & Kobayashi 2012; Venturini et al. 2015, 2016; Mordasini 2018), and the more recent pebble accretion model (Ormel & Klahr 2010; Lambrechts & Johansen 2012; Lambrechts et al. 2014, 2019; Johansen & Lambrechts 2017; Ndugu et al. 2018).
In most planet formation simulations the most important physical properties of disks, such as for example the surface densities of gas and solids and the temperature, are characterized by a monotonically decreasing power-law profile. However, recent observations of protoplanetary disks by ALMA (Atacama Large Millimeter Array) reveal that disks are rich in substructures, such as for example rings (Andrews et al. 2018). Rings are dust concentrations that arise naturally by the presence of pressure bumps (Dullemond et al. 2018).
From a theoretical point of view, there are some crucial obstacles that must be overcome in order to model the growth of planets from micrometer-size dust grains. The first is the so-called meter-size barrier, which refers to the difficulty in growing particles of 1 m (and above) in size due to the combined effect of fast radial drift and destructive collisions (see e.g, Blum & Wurm 2008). Another important problem is the rapid inward planet migration that makes it hard for planets to remain at a few astronomical units from the star (Ida & Lin 2008; Miguel et al. 2011). One possible solution is the existence of preferential regions for dust and planet growth, known as dust and planet traps, respectively. In dust traps, the drag force on dust grains vanishes, while in planet traps the torque exerted by the disk onto the planet is zero and migration is therefore halted. Particularly interesting is the case when a planet trap is generated by a density maximum, since in general (through the equation of state that links density and pressure) a pressure maximum isalso developed. Pressure maxima act as dust traps, collecting grains and helping their further growth to planetesimals, or even to embryo sizes via either coagulation (Brauer et al. 2008) or drag-induced instabilities (Youdin & Shu 2002; Johansen et al. 2009). If massive embryos form in a pressure maximum because of the subsequent accretion processes, they might be locked in the nearby developed planet trap. The combined effect of a planet trap and pressure maximum in promoting the formation of larger bodies, with sizes ranging between those of Mars and Jupiter, has been investigated by Lyra et al. (2008, 2009), Sándor et al. (2011), Regály et al. (2013), and Guilera & Sándor (2017). Pressure traps are naturally expected at locations in the disk where a transition inthe accretion flow occurs. Such transition can develop at the boundary between an accretionally active region, in which the magneto-rotational instability (MRI) might be dominant, and an accretionally less active region (usually referred to as a dead zone). A similar phenomenon occurs at the ice line, where below a certain temperature(usually of about 170 K for typical disk conditions) water vapor is condensed in the form of fluffy ice flakes, which due to their high surface-to-volume ratio efficiently trap free electrons in the plasma reducing its conductivity (Sano et al. 2000; Ilgner & Nelson 2006; Okuzumi 2009; Dzyurkevich et al. 2013). Based on these results, Kretke & Lin (2007) and Brauer et al. (2008) consider the ice line to be the location in the disk where the meter-size barrier problem could be overcome. The reduced conductivity leads to a steep decrease of the alpha viscosity parameter as has been shown by Lyra et al. (2015) in magneto-hydrodynamical (MHD) simulations, if the MRI is assumed to be the main reason for gas accretion. Due to the reduced turbulent viscosity, as the disk adapts to a new steady state, a maximum in surface density and – through the equation of state – pressure develops. Thus, the water ice line has been suggested as an ideal region wherein the meter size barrier could be overtaken.
In order to perform a detailed study of the formation of a planet within a pressure maximum by concurrent solid and gaseous accretion, one must combine a model of pebble and planetesimal growth and evolution and their accretion onto a planetary embryo, coupled with the cooling of the gaseous envelope and gas supply from the disk. The accretion of solids by a protoplanet is typically studied under the simplifying assumption of a unique dominant particle size: either centimeter pebbles or kilometer planetesimals. Recently, Alibert et al. (2018) and Venturini & Helled (2020) proposed and studied the formation of Jupiter by a hybrid accretion of pebbles and planetesimals. In this scenario, the core is formed fast by pebble accretion, and after the planet reaches the pebble isolation mass, the heat released by the accretion of planetesimals delays the onset of the gaseous runaway.
This hybrid accretion model could explain some measurements of isotopes in iron meteorites that provided evidence for the existence of two reservoirs of small bodies in the early Solar System, which remained separated from ~ 1 to ~ 3 Myr after the calcium–aluminium inclusion (CAI) formation (Kruijer et al. 2017). It could also account for the bulk and atmospheric enrichment of Jupiter suggested by recent internal structure models by Wahl et al. (2017); see also Venturini & Helled (2020). However, these works adopted some important simplifications: the massive core of the planet was already formed, and only the accretion of planetesimals and gas was computed. Also, in core accretion simulations for simplification, the planetesimals are usually placed initially in the disk without accounting for their formation.
The main goal of this study is to extend our previous work (Guilera & Sándor 2017), where we explored the formation of giant planets at the pressure maxima generated at the edges of a dead zone, incorporating a model of dust evolution, dust growth, and planetesimal formation together with a hybrid accretion of pebbles and planetesimals to study the formation of a giant planet at a pressure maximum in the disk. The paper is organized in the following way: in Sect. 2 we briefly describe our planet formation model with its new improvements, in Sect. 3 we present our results, in Sect. 4 we discuss our findings, and finally in Sect. 5 we draw our conclusions.
2 The model
In this work we consider a viscous evolving disk with a transition in the eddy viscosity at the water ice line, where the presence of ice flakes removes free electrons from the gas, leading to a jump in resistivity, similarly to Guilera & Sándor (2017). Our planet formation code PLANETALP allows us to calculate the formation of planets immersed in a protoplanetary disk that evolves in time. In this work, we also take into account a model of dust growth and evolution, coupled with a model of planetesimal formation by streaming instability. Thus, we are now able to compute the full process of planet formation: from a micron-sized dust population along the disk that evolves in time and forms planetesimals (when the conditions for the streaming instability are fulfilled), to the formation of a moon-size embryo that grows by the simultaneous accretion of pebbles and planetesimals in what is known as a hybrid accretion model (Alibert et al. 2018). We also consider the possible migration of the planet by computing the torque onto the planet in the type I migration regime (Tanaka et al. 2002; Paardekooper et al. 2011; Jiménez & Masset 2017) and the thermal torque due to the heat released by the planet into the disk as a result of the accretion of solid material (Benítez-Llambay et al. 2015; Masset 2017). These migration regimes were already included in Guilera et al. (2019). In the following sections, we summarize the main characteristics of our model and the improvements incorporated into this work. The rest of the model is described in detail in Ronco et al. (2017), Guilera & Sándor (2017), and Guilera et al. (2019).
2.1 The gaseous disk
As in Guilera & Sándor (2017), we use a classical 1D radial model (the isothermal version of PLANETALP Ronco et al. 2017), where the gaseous component of the disk is characterized by the corresponding surface density Σg. We define an initial disk with mass 0.05 M⊙ and initial gas surface density profile given by
 (1)
(1)
where R is the radial coordinate, Rc = 30 au is the characteristic radius, and γ = 1 is the surface density exponent (Andrews et al. 2010), while  is a normalization parameter that depends on the disk mass. For simplicity, the initial disk domain is defined between 0.1 and 30 au. The disk evolves as an α accretion disk (Pringle 1981),
![Mathematical equation: \begin{eqnarray*} \frac{\partial \Sigma_{\text{g}}}{\partial t}\,{=}\,\frac{3}{R}\frac{\partial}{\partial R} \left[R^{1/2} \frac{\partial}{\partial R} \left( \nu \Sigma_{\text{g}} R^{1/2} \right) \right],\end{eqnarray*}](/articles/aa/full_html/2020/10/aa38458-20/aa38458-20-eq3.png) (2)
(2)
where ν = αcsHg is the kinematic viscosity given by the dimensionless parameter α. The sound speed is given by
 (3)
(3)
where γg = 7∕5 is the adiabatic constant, kB is the Boltzmann-constant, μ = 2.3 is the mean molecular weight of molecular gas assuming a typical H–He composition, and mH is the mass of a proton. The radial temperature profile is given by
 (4)
(4)
The scale height of the disk is given by
 (5)
(5)
where Ωk is the Keplerian frequency. With the definition of Eq. (5), the volumetric gas density and the pressure at the disk midplane are given by,
![Mathematical equation: \begin{eqnarray*} \rho_{\text{g}} &=& \dfrac{\Sigma_{\text{g}}}{\sqrt{2\pi}~{H}_{\text{g}}},\\[3pt] {P}_{\text{g}} &=& c_s^2 \rho_{\text{g}}.\end{eqnarray*}](/articles/aa/full_html/2020/10/aa38458-20/aa38458-20-eq7.png)
As in Guilera & Sándor (2017), we consider a viscosity transition at the ice line (at ~ 3 au). We note that we use the same functional form to calculate the transition in the α-viscosity parameter used in Guilera & Sándor (2017), but without considering the outer edge of the dead zone. Thus, α takes values of 10−3 and 10−5 inside and outside the ice line, respectively. These are usually applied values for active and dead zones, respectively (e.g., Matsumura et al. 2009; Pinilla et al. 2016; Yang et al. 2018; Ogihara et al. 2018), but their change within some limits does not modify the outcome of this work. In Fig. 1 we illustrate the time evolution of the radial profiles of the gas surface density for our disk. As in Guilera & Sándor (2017), a density and pressure maximum is formed at the location of the viscosity transition.
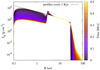 |
Fig. 1 Viscous evolution of the gas surface density radial profiles during the first 0.5 Myr. |
2.2 Dust growth
In order to compute the growth of the dust particles along the disk, we follow the approach derived by Drążkowska et al. (2016, hereafter D16) and Drążkowska & Alibert (2017) based on the results of Birnstiel et al. (2011, 2012). In this model, the maximum size of the dust particles at each radial bin is limited by the combined effects of the dust coagulation, radial drift, and fragmentation. As we consider a region of low-viscosity in the disk, and as was pointed out by D16, we also include a growth limitation due to the fragmentation induced by differential drift. Thus, the maximum size at a given time is given by
 (8)
(8)
where  is the initial dust size. τgrowth is the collisional growth timescale
 (9)
(9)
with Z = Σd∕Σg being the dust-to-gas ratio. The maximum size of dust particles limited by radial drift is given by
 (10)
(10)
where fd = 0.55 (Birnstiel et al. 2012), vk is the Keplerian velocity, and  is the bulk dust density taking values of 3 and 1 g cm−3 inside and outside the ice line, respectively, considering that the dust inside the ice line is fully composed of silicates and that the dust outside the ice line is composed of a mixture of silicates and ices (Drążkowska & Alibert 2017). Furthermore, cs is the sound speed in the gas disk, and Pg the gas pressure. The maximum size of dust particles limited by the fragmentation process is then set by
 (11)
(11)
where ff = 0.37 (Birnstiel et al. 2011), and we use a fragmentation threshold velocity vth of 1 m s−1 for silicate dust and 10 m s−1 for dust containing more than 1% of water ice (Drążkowska & Alibert 2017). Equation (11) considers that fragmentation is driven by the turbulent velocities. However, if the viscosity in the disk midplane becomes very low, fragmentation could be driven by differential drift. Therefore, the maximum size of dust particles determined by fragmentation in laminar disks is given by (Birnstiel et al. 2012)
 (12)
(12)
2.3 Dust evolution
Due to the fact that the dust is strongly coupled to the dynamics of the gas, the time evolution of the dust solid surface density, Σd, is calculated using an advection-diffusion equation,
![Mathematical equation: \begin{equation*} \frac{\partial}{\partial t} \left(\Sigma_{\text{d}}\right) + \frac{1}{R} \frac{\partial}{\partial R} \left( R \,\overline{v}_{\text{drift}} \,\Sigma_{\text{d}} \right) - \frac{1}{R} \frac{\partial}{\partial R} \left[R \,D^{*} \,\Sigma_{\text{g}} \frac{\partial}{\partial R} \left( \frac{\Sigma_{\text{d}}}{\Sigma_{\text{g}}} \right) \right]\,{=}\,\dot{\Sigma}_{\text{d}},\end{equation*}](/articles/aa/full_html/2020/10/aa38458-20/aa38458-20-eq15.png) (13)
(13)
where t is the temporal coordinate. Here,  represents the sink term due to both planetesimal formation and planet accretion (see next sections).
  is the dust diffusivity (Youdin & Lithwick 2007),
  being the mass-weighted mean Stokes number of the dust size distribution (the dust distribution remains always in the Epstein drag regime). In this latter expression,
  represents the mass-weighted mean radius of the dust size distribution, given by
 (14)
(14)
with  being the radius of the dust particle of the species i, and
  the ratio between the volumetric dust density of the species i and the volumetric gas density given by
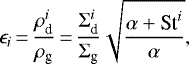 (15)
(15)
with  being the Stokes number of the dust i-species.
Following the same approach described in Appendix A of D16, the dust-drift velocity of the i-species  is given by
 (16)
(16)
where the headwind ηvk is given by
 (17)
(17)
The quantities A and B are given by1
 (18)
(18)
where the dimensionless quantities X and Y are (Dipierro et al. 2018; Gárate et al. 2020)
 (19)
(19)
As in D16, we use a power-law for the dust size distribution (or Stokes number distribution) given by
 (20)
(20)
which implies a dust mass distribution n(m) ∝ m−11∕6 where most of the dust mass remains in the biggest dust particles (Birnstiel et al. 2011). Consequently, the mass weighted mean dust drift velocity results in
 (21)
(21)
In order to calculate D* and  to solve Eq. (13), as in D16 we use 200 dust size bins between
  and
and  for each radial bin.
The initial dust surface density is given by
 (22)
(22)
where ηice takes into account the sublimation of water ice given by
![Mathematical equation: \begin{eqnarray*} \eta_{\text{ice}}\,{=}\,\begin{cases} 1 & \text{ if $R \ge R_{\text{ice}}$}, \\[6pt] {\dfrac{1}{\beta}} & \text{ if $R < R_{\text{ice}}$}, \end{cases}\end{eqnarray*}](/articles/aa/full_html/2020/10/aa38458-20/aa38458-20-eq36.png) (23)
(23)
with Rice ~ 3 au, the so-called ice line, β = 2 (Lodders 2003), and z0 = 0.01 as the classical initial dust-to-gas ratio.
Finally, Eq. (13) is solved using an implicit Donor cell algorithm considering zero density as boundary conditions, and the time-step is controlled by not allowing changes greater than 1% in the dust surface density for each radial bin between consecutive models.
2.4 Planetesimal formation by streaming instability
The streaming instability (Youdin & Goodman 2005; Johansen et al. 2007) can be a possible mechanism for the spontaneous formation of km-sized planetesimals due to the clumping of radially drifting small particles. However, this process is not triggered along the entire protoplanetary disk, but in specific regions where dust pile-ups occur as a result of different mechanisms, such as for example dead zones, photoevaporation, and vortices (Drążkowska et al. 2016; Drążkowska & Alibert 2017; Ercolano et al. 2017).
Following Drążkowska & Dullemond (2014) and D16, we implement a similar model of planetesimal formation by checking, for every radial bin and at every time-step, whether or not the density of large pebbles (with St > 10−2) is comparable to the gas density:
 (24)
(24)
At the locations (and times) where this condition is fulfilled, part of the dust surface density is transferred to a planetesimal surface density following
 (25)
(25)
where ζ = 10−3 is the planetesimal formation efficiency parameter (Drążkowska & Alibert 2017), and TK the orbital period. A validation of the dust growth, dust evolution, and planetesimal formation in our model, comparing our results with the fiducial ones of D16, is presented in Appendix A.
The time evolution of the planetesimal surface density Σp is calculated by solving the advection-diffusion Eq. (13), as in the case of pebbles. The time evolution of planetesimal eccentricities and inclinations (and the corresponding drift velocities, planetesimal–planet relative velocities, and the planetesimal accretion rates) are calculated as in Guilera et al. (2014), considering the stirring due to the gravitational perturbations by the planet and the damping due to gas drag. Because the formed planetesimals are assumed to be of 100 km radii, their Stokes numbers are much greater than unity. Thus, the planetesimal distribution is always in the Quadratic drag regime (instead on the Epstein regime), and the contribution of the diffusion term in the advection–diffusion equation is negligible.
2.5 Planet growth and migration
Once the solid mass accumulated at the pressure bump in the form of planetesimals is enough to form a Moon-mass embryo, we put an embryo of this mass at the pressure bump location (Liu et al. 2019). The embryo subsequently grows by the concurrent hybrid accretion of pebbles and planetesimals, and the surrounding gas.
In the case of pebbles (particles with St ≤ 1), the pebble accretion rate is given by Lambrechts et al. (2014):
 (26)
(26)
where MC is the mass of the core, and freduc = min(1, RH∕Hp) takes into account a reduction in the pebble accretion rate if the scale height of the pebbles,  , becomes greater than the Hill radius of the planet. The planet can accrete pebbles until it reaches the so-called pebble isolation mass (Lambrechts et al. 2014). When the planet becomes massive enough, the perturbations it generates in the gaseous disk develop a partial gap, and the planet produces a pressure bump beyond its orbit. This pressure bump, which is different from the one generated by the viscosity transition at the ice line, also acts as a dust trap. When this happens, the accretion of pebbles by the planet is limited. Thus, when the planet reaches the pebble isolation mass given by (Lambrechts et al. 2014)
 (27)
(27)
we consider that the pebble accretion rate is halted (aP represents the planet location). However, we note that pebble accretion has not yet been studied in a density maximum of a protoplanetary disk, and therefore the maximum size that a solid core can achieve by pebble accretion is uncertain. It may also happen that a core can grow larger than the isolation mass determined in disks where the surface density profile is described by a radial power-law profile (Sándor & Regály, in prep.). Therefore in Sect. 3.4 we also show a simulation in which the pebble isolation mass is increased. We note that in order to compute Eq. (26), we use the mass-weighted mean Stokes number of the dust-size distribution  .
.
In the case of planetesimals we use, as in our previous works, the planetesimal accretion rate for the oligarchic growth derived by Inaba et al. (2001):
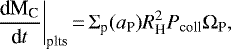 (28)
(28)
where Σp(aP) is the surface density of planetesimals at the location of the planet, RH is the Hill radius of the planet, and Pcoll is the collision probability. Here, Pcoll depends on the planetesimal–planet relative velocities and on the enhanced capture radius of the planet due to the gaseous envelope (Inaba & Ikoma 2003).
For the growth of the envelope, we compute the gas accretion solving the standard stellar evolution equations as in Guilera et al. (2014) but considering that the energy released by the solid accretion is strictly deposited in the core. In addition, in Appendix B we compare the results from the fiducial simulations to the results computing the gas accretion adopting the prescriptions from Ikoma et al. (2000). We note that if the gas-accretion rate exceeds the amount that can be provided by the disk (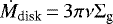 calculated at the location of the planet), the gas accretion onto the planet switches to the disk supply.
Regarding the migration of the planet, if the planet is not massive enough to open a gap in the gaseous disk, we consider that the torque exerted by the gaseous disk onto the planet is given by
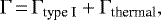 (29)
(29)
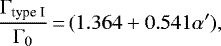
where Γtype I represents the classical torque associated to the type I migration (Lindblad and corotation torques), and Γthermal takes into account the heat released by the planet due to the solid accretion (Masset 2017). For consistency, as in Guilera & Sándor (2017), we consider Γtype I for isothermal disks from Tanaka et al. (2002) the fiducial simulations,
 (30)
(30)
with α′ = d logΣg∕d logR at the planet location, and 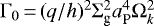 , where q is the planet and the central star mass ratio, and the aspect ratio h, the gas surface density, and the Keplerian frequency are calculated at the planet location. We note that the normalized torque, Γtype I∕Γ0, only depends on the local gradient of the gas surface density.
For completeness, we also perform simulations adopting type I migration prescriptions derived for nonisothermal disks. In particular, we adopt also the migration recipes from Paardekooper et al. (2011) and Jiménez & Masset (2017). For both recipes, the normalized torque, Γtype I∕Γ0, can be expressed as (see Guilera et al. 2019, for details)
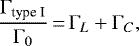 (31)
(31)
where ΓL is the Lindblad torque and ΓC is the corotation torque. In both cases, the Lindblad torque can be expressed as ΓL = c1 + c2β′ + c3α′, with β′ = d logT∕d logR being the local disk temperature gradient at the planet location. The constants c1, c2, and c3 slightly differ between both recipes. Regarding the corotation torque component, its expression is more complex for both prescriptions; it depends mainly on the mass of the planet, the width of the corotation region, and the properties of the disk, such as the viscosity, opacity, thermal diffusivity, and so on (see Appendix of Guilera et al. 2019, for details). As it was shown in Guilera et al. (2019), the contribution of the corotation torque is where both migration recipes present more differences.
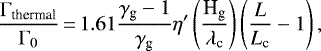
To compute Γthermal we use the same methodology as in Guilera et al. (2019), where Γthermal is given by (Masset 2017)
 (32)
(32)
where η′ = α′∕3 + β′∕6 + 1∕2, and  , with χ being the gas thermal diffusivity at the location of the planet. Here, L is the luminosity of the planet due to solid accretion and Lc represents a critical luminosity (see Guilera et al. 2019, for details). We note that when the mass of the planet becomes greater than the critical thermal mass, defined by (Masset 2017)
 (33)
(33)
with G the gravitational constant, the thermal torque is halted.
As we are interested in the early formation of a proto-giant planet, for simplicity we stop our simulations when the planet becomes massive enough to open a gap in the disk following the criterion given by Crida et al. (2006). Thus, type II migration is not considered in this work.
3 Results
In the following sections we first compute the gas and dust disk evolution without considering planet formation and describe the main characteristics of the whole process, including dust growth and planetesimal formation by streaming instability. We then include planet formation at the pressure maximum by the hybrid accretion of pebbles and planetesimals.
3.1 Disk evolution without planets
At first we just compute the dust evolution, dust growth, and the formation of planetesimals in the regions where the conditions for the streaming instability are fulfilled, but without placing any embryo.
In Fig. 2 we show the time evolution of the radial profiles of the surface density of dust and planetesimals using the same disk parameters as the ones described in Sect. 2.1. We note that the dust is very efficiently accumulated at the pressure maximum located at ~ 3 au (see Fig. 1). This is a natural consequence of the null value of the pressure gradient and dust drift velocity at that location. The surface density of dust increases by about two orders of magnitude at this position, allowing the formation of planetesimals by the streaming instability. Since the pressure maximum moves slightly outwards in time, as was noticed in Guilera & Sándor (2017), this region is a narrow ring of ~ 0.3 au and not a fixed unique value of semi-major axis. In contrast to Guilera & Sándor (2017), the dust diffusion which is now considered in Eq. (13), does not allow for significant dust accumulation at the inner edge of the disk (at ~ 0.1 au) and a significant amount of dust is lost inside the ice line (see Fig. A.3 of Guilera & Sándor 2017). In contrast to D16, we find that the condition for the streaming instability is not fulfilled in the inner part of the disk. This is due to the fact that the fragmentation threshold velocity considered in D16, which is constant along the disk, is much higher (between 8 and 15 m s−1) than the one used here for pure silicate dust. A similar result was found in Drążkowska & Alibert (2017).
Figure 3 shows the time evolution of the total mass of solids in the disk. Initially, all the solid mass of the disk remains in dust particles of 1 μm. The disk has initially ~100 M⊕, and as time evolves the dust mass decreases due to dust diffusion and accretion onto the star. The efficient accumulation of dust at the pressure maximum allows the formation of planetesimals by streaming instability at this location in a few thousand years. In about 105 yr, ~ 17.5 M⊕ of dust is transformed into planetesimals; after that, no further planetesimals form and the planetesimal mass remains basically constant. This is due to the significant decrease in the surface density, flux, and mass of pebbles, and the mass of dust which continues decreasing by dust diffusion and accretion onto the star.
In Fig. 4, we show the time evolution of the maximum dust size that the dust population can reach along the disk. Due to the fact that beyond the ice line, the threshold velocity for ice-rich dust is higher than in the inner part of the disk, dust can grow to larger sizes. In particular, near the pressure maximum, where the gas and dust surface densities are higher, the particles reach sizes of ~ 10 m ( ,
,  and
and  from Eq. (8) are proportional to Σd and Σg). In the inner part of the disk, the dust can only grow to sizes up to ~0.1 cm.
Figure 5 shows the time evolution of the corresponding mass-weighted mean Stokes number of the dust population along the disk. The mean Stokes number at the pressure maximum reaches values near unity, higher than the St > 0.01 needed to fulfill the streaming instability condition, allowing the formation of planetesimals.
We note that as we consider that the disk temperature does not evolve in time, the location of the viscosity transition does not change in time. In general, in nonisothermal disks the temperature decays in time and the ice line moves inward. Therefore, in more realistic disks the location of the viscosity transition could also move inward over time. However, despite our simplification, we show that the efficient accumulation of dust at the pressure maximum generated at the viscosity transition allows the formation of planetesimals in a short period of time. Thus, our model can be a good approximation if the timescale of the drift of the ice line is not much shorter than the one corresponding to the formation of planetesimals.
We also note that, for simplicity, the disk is initially cut at 30 au. The initial outer disk edge defines the initial disk mass and regulates the time evolution of the pebble flux, and therefore it could play an important role. However, this is not the case in this study since the pressure bump at the ice line efficiently collects the inward drifting pebbles and the pebble isolation mass is quickly reached by the planet (see following section).
 |
Fig. 2 Time evolution of the radial profiles of the surface density of dust (panel a) and planetesimals (panel b). Planetesimals are only formed near the pressure maximum location. This simulation corresponds to the case of the disk evolution without planet formation. |
 |
Fig. 3 Time evolution of the total mass of solids, dust, and planetesimals. In just 5 × 10⁵ yr almost all of the dust has been removed from the disk. The simulation corresponds to the case of the disk evolution without planet formation. |
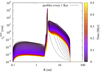 |
Fig. 4 Time evolution of the radial profiles of the maximum sizes that the dust can reach. The maximum sizes for the dust population are reached at the pressure maximum location. The simulation corresponds to the case of the disk evolution without planet formation. |
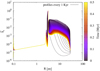 |
Fig. 5 Time evolution of the radial profiles of the mass weighted mean Stokes number of the dust size distribution. As for the dust sizes, the maximum values are reached at the pressure maximum location. The simulation corresponds to the case of the disk evolution without planet formation. |
3.2 Giant planet formation at the pressure maximum location
As mentioned above, once the mass in planetesimals reaches the mass of the Moon, we transform this mass into an embryo and insert it at the location of the pressure maximum, where planetesimals form. After that, the pebbles in the outer region of the disk continue to accumulate at the pressure bump and pebbles continue forming planetesimals (when the SI criterion is fulfilled). Thus, the embryo grows by the concurrent accretion of pebbles, planetesimals, and the surrounding gas.
In Fig. 6 we show the time evolution of the mass of the core (black lines) and the mass of the envelope of the planet (red lines) for two different simulations. In these simulations, the embryo initially grows mainly due to accretion of pebbles, because the surface density and flux of pebbles dominate. Due to the significant amount of pebbles accumulated at the density/pressure maximum, the planet reaches the pebble isolation mass (of ~ 13.5 M⊕) at only ~ 2 × 10⁴ yr.
In order to analyze the gas accretion, we first compute, for the sake of simplicity, a simulation where we neglect planetesimal accretion once the pebble isolation mass is reached. The growth of the envelope for this simulation is represented by the red dashed line (Fig. 6). To compute the gas accretion we use our full model, that is, we solve the envelope structure and transport equations via a Henyey method (Benvenuto & Brunini 2005). We show that if solid accretion suddenly stops, gas is accreted very efficiently and the formation of a gas giant occurs on a timescale of ~ 105 yr. In the case presented here, the cross-over mass (when the mass of the envelope becomes equal the mass of the core, and runaway gas accretion is triggered) is reached at~1.5 × 10⁵ yr, and the simulation stops when the planet opens a gap in the disk at ~ 3 × 10⁵ yr. This happens because once solid accretion is halted, there is not enough heat to prevent the fast compression of the envelope, which boosts the accretion of gas.
The second simulation corresponds to the more realistic case where the accretion of planetesimals continues after the planet reaches the pebble isolation mass (red-solid line of Fig. 6). The time evolution of the solid accretion rate can be seen in Fig. 7. We can see that because of the significant accumulation of pebbles at the density and pressure maximum, the solid accretion rate remains very high until the planet reaches the pebble isolation mass. After that, the solid accretion rate drops about two orders of magnitude and then it is due entirely to the accretion of planetesimals. We remark that in this simulation, after the planet reaches the pebble isolation mass, the formation of planetesimals is stopped. This is because at this point, the planet generates a partial gap in the gaseous disk and the flux of pebbles is halted. Thus, the planetesimal accretion rate decreases in time from ~ 10−5 M⊕ yr−1 to ~ 3 × 10⁻⁷ M⊕ yr−1 by two factors: the accretion of planetesimals that decreases the planetesimal surface density and the increase in the relative velocities between the planet and the planetesimals caused by the gravitational perturbations as the planet grows.
Regarding the gas accretion in this last scenario, we clearly see that the accretion of planetesimals delays the onset of the gaseous runaway. The energy released by the accretion of planetesimals avoids the fast compression of the envelope layers, slowing down the accretion of gas. In this case, the planet opens a gap in the disk (and the simulation stops) when it reaches a total mass of ~ 85 M⊕ at about 1.5 Myr. This implies a delay of about 1.2 Myr compared to the case where the accretion of planetesimals is neglected.
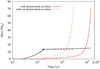 |
Fig. 6 Time evolution of the mass of the core (the black lines) and the envelope mass of the planet (the red lines). The solid lines represent the model where the hybrid accretion of pebbles and planetesimals is considered. The dashed lines correspond to the case where the accretion of planetesimals after the planet reaches the pebble isolation mass (black filled dot) is neglected. |
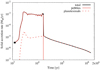 |
Fig. 7 Time evolution of the solid accretion rate for the simulation where the hybrid accretion of pebbles and planetesimals is considered. The black filled square corresponds to the time at which the embryo is introduced in the simulation. Initially, the total solid accretion rate is dominated by the accretion of pebbles (the solid red line). After the planet reaches the pebble isolation mass (black filled dot), the accretion rate decays significantly and is only due to the accretion of planetesimals (the dashed red line). |
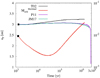 |
Fig. 8 Time evolution of the semi-major axis of the planet for the simulations corresponding to the case where the hybrid accretion of pebbles and planetesimals is considered. The black line corresponds to the fiducial simulation where type I migration recipes from Tanaka et al. (2002, T02) are adopted. The purple and green lines correspond to the cases where type I migration recipes from Paardekooper et al. (2011, P11) and Jiménez & Masset (2017, JM17) are considered, respectively.For the cases T02 and JM17, the planet remains in a migration trap until it opens a gap in the gas disk. The red line represents the values of the critical thermal mass associated to the thermal torque (for the T02 case). As this mass is always much lower than the mass of the planet, the thermal torque does not have any effect on the torque over the planet. |
3.3 Effect of type I migration
For the fiducial simulations described in the previous section, type I migration from Tanaka et al. (2002) plus the thermal torque from Masset (2017) was included. Figure 8 shows the evolution of the semi-major axis of the planet and the critical thermal mass (see definition in Sect. 2.5) for the case where the hybrid accretion of pebbles and planetesimals is considered (black line). First, we can see that the critical thermal mass remains always lower than the mass of the planet. Indeed, it only becomes greater than 0.01 M⊕ (the initial mass of the embryo) at about 4 × 10⁵ yr, after the planet has reached the pebble isolation mass. Thus, the thermal torque is not contributing to the total torque onto the planet. We note that this situation could change if a more complex treatment of the thermodynamics of the disk is considered. However, the computation of the vertical structure in a nonisothermal disk with a viscosity transition at the ice line presents some challenges. The main problem lies in the computation of the vertical structure of the disk, which yields the mid-plane temperature, mean viscosity, and so on. Those calculations require previous knowledge of α, and hence, of the exact location of the transition in α, which also depends on the midplane temperature. Some iterative procedure should be envisioned to tackle such a problem, but this is beyond the scope of the present study. Moreover, the initial location of the ice line also depends on the particular initial mass of the disk and the initial gas surface density. Thus, in this work we keep the simplified approach of an isothermal vertical disk with a temperature profile that does not evolve in time.
As in Guilera & Sándor (2017), we find that the density and pressure maximum acts as a planet migration trap for the fiducial simulation where the hybrid accretion of pebbles and planetesimals is considered. As we showed in Guilera & Sándor (2017), the density and pressure maximum generates a zero-torque location nearby (at ~ 3 au). This zero-torque location remains during the formation of the planet until it switches to type II migration. This is because during type I migration the normalized torque for isothermal disks only depends on the local gradient of the gas surface density (see Eq. (30)). When this occurs, the planet migrates inward. Thus, the pressure maximum generated by the viscosity transition does not prevent the existence of gas giants in the inner region of the disk.
In addition, we also perform two new simulations changing the type I migration recipes from those of Tanaka et al. (2002) to those of Paardekooper et al. (2011) and Jiménez & Masset (2017). With this, we want to analyze whether or not the planet migration trap could be a robust result even using more sophisticated type I migration recipes, which were derived for nonisothermal disks. We remark that despite our simplifications in the computation of the thermodynamics of the disk, we compute the time evolution of the radial profiles of all the quantities needed to calculate the migration recipes mentioned above, that is, we compute the time evolution of the radial profiles of the density, pressure, opacity, and so on while the temperature radial profile remains fixed in time. Explicitly, the simplification lies in the fact that the evolution of the temperature is not linked self-consistently with the evolution of the gas surface density. We can see in Fig. 8 that the density and pressure maximum also acts as a planet migration trap using the type I migration recipes from Jiménez & Masset (2017). However, using the type I migration prescriptions from Paardekooper et al. (2011), the migration trap is broken close to the mass needed for the planet to open a gap in the disk. This happens because now the normalized torque is not only a function of the local gradient of the gas surface density (as in the isothermal case) but also of the local gradient of the temperature, the viscosity, and the mass of the planet (these last two dependencies through the corotation torque). Thus, the combination of such quantities breaks the migration trap at some moment. Guilera et al. (2019) showed that the main differences between the migration recipes from Jiménez & Masset (2017) and Paardekooper et al. (2011) lie in the computation on the corotation torque. Thus, in this case, when the planet reaches a mass of a several tens of Earth masses, the migration trap is broken. At this moment, the planet quickly migrates inwards (due to the fact that it has a mass of ~ 80 M⊕) until it opens a gap at ~1.15 au. We note that the time evolution of the mass of the core and the mass of the envelope for the simulations using the type I migration recipes from Paardekooper et al. (2011) and Jiménez & Masset (2017) are very similar to those of the fiducial simulation. In Fig. 9, we emphasize this by plotting the planet formation tracks as a function of time. Simulations also stopped when the planets opened a gap in the disk. This happens when the total mass of the planet is about 110 M⊕ for the case where we used the migration recipes from Paardekooper et al. (2011) and about 95 M⊕ for the case where we adopt the migration recipes from Jiménez & Masset (2017). The differences in the total mass at which the planet opens the gap are due to the fact that this mass depends on the viscosity of the disk. Inside the ice line, the viscosity is larger (because of the larger α-parameter), and therefore the total mass of the planet has to be higher to open a gap. For the second case, the planet opens the gap in the α transition region between 10−5 (outside the ice line) and 10−3 (inside the ice line). We note that if the thermodynamics of the disk are computed self-consistently, the migration trap can break at a different planet mass depending mainly on the viscosity and thermal diffusivity of the disk (see Morbidelli 2020).
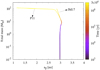 |
Fig. 9 Planet formation tracks for the simulations using the type I migration recipes from Paardekooper et al. (2011, P11) and Jiménez & Masset (2017, JM17). |
3.4 The pebble isolation mass
In the previous sections we adopted the pebble isolation mass estimated by Lambrechts et al. (2014). The pebble isolation mass is a very important quantity because it determines the maximum core size achievable by pure pebble accretion. The maximum value that a core can reach also has an important role in the gas accretion rates. The more massive the core becomes, the higher the gas accretion rates when the pebble accretion is halted (Ikoma et al. 2000). The pebble isolation mass strongly depends on the disk properties, mainly on the disk aspect ratio and on the disk viscosity, both at the location of the planet (e.g., Bitsch et al. 2018). Recently, Ataiee et al. (2018) studied the dependence of the pebble isolation mass on disk viscosity and also how the dust diffusion modifies the pebble isolation mass obtained from pure gas hydrodynamical simulations. For this last case, these latter authors find that the pebble isolation mass is given by
 (34)
(34)
where M⋆ is the mass of the central star (1 M⊙ in this work), and hP and αP are the disk aspect ratio and the α-viscosity parameter at the location of the planet, respectively. They also studied how dust diffusion modifies the pebble isolation described above through hydrodynamic simulations of gas and dust. For particles with Stokes numbers greater than 0.05 and a fixed disk aspect ratio, Ataiee et al. (2018) find that the ratio between both isolation masses is a factor greater than unity, which is also α-dependent. For the lowest α value studied by these latter authors (α = 5 × 10⁻⁴), they find that this factor is 1.3. Thus, as a conservative approach, we take this value, meaning that the pebble isolation mass with dust diffusion is given by
 (35)
(35)
In Fig. 10, we plot the time evolution of the mass of the core and the mass of the envelope for the case where  and
and  are considered, and compare these to the fiducial simulation. We find that
  is ~ 10 M⊕, which is slightly smaller than what was found in the fiducial simulation using the prescriptions from Lambrechts et al. (2014). However, we find that
  gives us a larger pebble isolation mass of ~15 M⊕. The results show a good agreement despite that the pebble isolation mass proposed by Lambrechts et al. (2014) does not take into account the dependence with the α-viscosity parameter. Despite the differences in the pebble isolation mass, the gas accretion rates onto the planet are similar, and formation timescales are larger for smaller cores. We also note that all of the above-mentioned studies included hydrodynamical simulations for standardprotoplanetary disks that do not present pressure bumps.
Recently, Sándor & Regály (in prep.) investigated pebble accretion and pebble isolation mass in a generic pressure maximum of a protoplanetary disk performing two-fluid 2D hydrodynamical simulations of gas and dust, treating the dust as a pressureless fluid. They found that in this scenario, when the planet opens a partial gap, halting the flux of incoming pebbles, there is a significant amount of pebbles (and gas) in the co-rotation region of the planet which is available to be accreted. In order to mimic this situation with our simpler disk model, we performed a simulation in which when the planet reaches the pebble isolation mass, we set the dust drift velocities to zero, thereby halting the incoming flux of pebbles. In this context, the planet can continue growing by accreting pebbles that remain in its feeding zone. In Fig. 11, we can see thatin this situation (the black dashed lines), the mass of the core continues growing until it reaches ~ 30 M⊕ asymptotically, and the planet triggers the runaway gas accretion phase in only ~ 3 × 10⁵ yr. We note that the growth of the core is qualitatively very similar to the results found by Sándor & Regály (in prep.), where for a planet growing at a pressure bump there is not a well-defined pebble isolation mass.
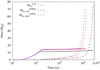 |
Fig. 10 Time evolution of the mass of the core and the envelope mass of the planet considering the pebble isolation masses given by Ataiee et al. (2018), compared to the fiducial case where we adopt the pebble isolation masses from Lambrechts et al. (2014).
|


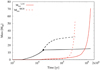 |
Fig. 11 Time evolution of the mass of the core (the black lines) and the envelope (the red lines) of the planet for the fiducial simulation (the solid lines) and the case where the planet is allowed to accrete the pebbles at its co-orbital region after it has reached the pebble isolation mass (the dashed lines). |
4 Discussion
In this section, we discuss the implications of our model, and add some comparisons with previous work.
4.1 From dust to gas giants, including pebble and planetesimal accretion
In this work, we studied if a pressure maximum generated by a viscosity transition at the ice line can act as an efficient location for dust trap, dust growth and planetesimal formation by streaming instability. We showed that indeed at the pressuremaximum location dust is very efficiently accumulated. As the Stokes numbers of pebbles is about St ~ 1, these particles rapidly migrate to the disk midplane, meaning that the ratio between the volumetric density of solids and gas exceeds unity, and streaming instability sets in. We also show that if an embryo is located at the planetesimal-forming region, it can reach the pebble isolation mass on a timescale of a few tens of thousands of years.
The recent studies by Alibert et al. (2018) and Venturini & Helled (2020) suggest that Jupiter could form by hybrid accretion of pebbles and planetesimals. In this scenario, first a massive core is formed mainly by the accretion of pebbles. After the planet reaches the pebble isolation mass, the energy released by the accretion of planetesimals prolongs the time taken for the planet to reach the gaseous runaway phase by a few million years. This scenario could naturally explain the time required for the formation oftwo reservoirs of small bodies in the early Solar System (Kruijer et al. 2017), and the atmospheric enrichment of Jupiter by Wahl et al. (2017).
In the present paper, we additionally consider such a hybrid accretion scenario in a complete self-consistent manner. We show that the accretion of planetesimals after attaining the pebble isolation mass effectively delays the onset of the gaseous runaway phase by at least 1 Myr. As in Alibert et al. (2018), the energy released by the planetesimal accretion avoids the quick compressionof the envelope. While in Alibert et al. (2018) the planetesimal accretion rate is constant, in the present work the planetesimal accretion rate decreases in time by about two orders of magnitude because of the gravitational pull of the planet on the planetesimals, and due to the decrease in the planetesimal surface density by planet accretion. This is in line with the results obtained by Venturini & Helled (2020) who found a decrease in the planetesimal accretion rates for short orbital periods (for R ≲ 3 au). They also found that for larger distances, the planet never empties its feeding zone, and so the planetesimal accretion rate decreases much slower. Thus, the hybrid accretion scenario could delay the gas accretion for even longer at slightly greater orbital periods. In any case, the qualitative picture that we find for the formation of a giant planet is the same as in Alibert et al. (2018): a massive core is formed mainly by the accretion of pebbles and the accretion of planetesimals prolongs the time taken for the planet to reach the gaseous runaway phase. Moreover, the giant planet formation picture in this hybrid scenario is qualitatively similar to the one found by Pollack et al. (1996), with one difference being that here the phase 1 (the first phase when a massive core is formed) is characterized mainly by the accretion of pebbles until the planet reaches the pebble isolation mass.
Finally, we show that the pressure maximum acts as a planet migration trap if type I migration recipes for isothermal disks are used. Despite the fact that we are using a vertical isothermal disk, and that the temperature profile does not evolve over time, we also tested the previous result using planet migration recipes derived for nonisothermal disks. We find that when using the migration recipes from Jiménez & Masset (2017), the pressure bump continues working as a planet migration trap. However, if we adopt the migration recipes from Paardekooper et al. (2011), the migration trap is broken when the mass of the planet is of about several tens of Earth masses. Thus, pressure bumps are not only preferential locations for planet growth, but can also act as planet migration traps helping giant planets to survive at moderate to large distances from the central star.
4.2 Gas accretion onto the planet and the pebble isolation mass
In the fiducial simulations, we show that if the solid accretion is halted after the planet reaches the pebble isolation mass at ~ 13.5 M⊕, the gas accretion runaway phase is triggered in only a few hundred thousand years. However, when the hybrid accretion of pebbles and planetesimals is considered, the heat released by the planetesimals delays the onset of the runaway of gas by ~ 1.2 Myr. We also studied the dependence of our results on the pebble isolation mass. Ataiee et al. (2018) studied the dependence of the pebble isolation mass on the alpha-viscosity parameter using hydrodynamical simulations, analyzing also how dust diffusivity can increase the pebble isolation mass found by pure gas hydro-simulations. We find that the pebble-isolation mass derived for pure gas hydro-simulations is slightly lower than that computed in the fiducial simulations given by Lambrechts et al. (2014). As a consequence, the onset of the gas runaway phase is prolonged by about a factor two. On the other hand, the pebble isolation mass computed taking into account the dust diffusion is larger than the fiducial case and the growth of the planet is very similar. Finally, Sándor & Regály (in prep.) recently showed, using hydrodynamical simulations of gas and dust, that in a pressure bump, when the planet opens a partial gap, there is still a significant amount of gas and pebbles in the corotation region of the planet. These latter authors found that for Stokes numbers St ≳ 0.1, the planet can accrete efficiently at least a part of this available material and that the pebble isolation mass might not be a well-defined quantity due to the fact that the planet can grow asymptotically. Thus, we also mimic this scenario where the planet is allowed to accrete the pebbles that remain in the corotation region when it reaches the pebble isolation mass. We find a qualitatively similar result to that of to Sándor & Regály (in prep.), and the planet core grows asymptotically to ~ 30 M⊕. In this case, because of the large mass of the core, the planet triggers the gaseous runaway phase in only a few hundred thousand years.
We note that in all our simulations, the accreted solids reach the planet core and do not pollute the H–He envelope. However, the gas accretion by the planet from the disk can be significantly modified if envelope enrichment by heavy elements is considered. Venturini et al. (2016) showed that if the sublimated water coming from the icy pebbles or planetesimals is uniformly mixed along the envelope, the mean molecular weight of the envelope rises, leading to a more efficient envelope contraction that enhances gas accretion. In addition, Brouwers et al. (2018) and Brouwers & Ormel (2020) found similar results if the sublimated silicate by the accretion of dry-pebbles is well mixed at the bottom of the envelope. However, in this last case, Bodenheimer et al. (2018) find that if a compositional gradient is formed between the fully saturated silicate-vapor inner envelope and the nonpolluted outer H–He envelope, the gas accretion from the disk onto the planet decreases. Despite the fact that the incorporation of envelope enrichment is well beyond the scope of this paper, we plan to include this complex phenomenon in future works.
4.3 Transition viscosities as rings in protoplanetary disks
Recently, Morbidelli (2020) presented a semi-analytical study of the formation of massive cores by pebble accretion in pressure bumps with Gaussian profiles (Dullemond et al. 2018). He found that DSHARP (disk substructures at high angular resolution) rings are too far from the star to allow the formation of massive planets within the lifetime of the disk. However, a similar ring re-scaled to 5 au could lead to the formation of a massive core in less than 0.5 Myr if pebble accretion is efficient. It is interesting for us to highlight that the transition viscosity adopted in this work also generates pseudo-Gaussian profiles. This can be seen in Fig. 12, where we plot a zoom around the viscosity-transition region of the surface density of gas to show this. Thus, our study has some similarities to that of Morbidelli (2020). To emphasize this, Fig. 13 shows three snapshots in time of the gas surface density, dust surface density, and pressure of the disk (arbitrarily re-scaled as in Morbidelli 2020) for the fiducial simulation until the planet reaches the pebble isolation mass. We can see that the scenario is very similar to the one studied by Morbidelli (2020). Moreover, Morbidelli (2020) also found that planet Type-I migration is stopped in the ring, but not necessarily at its center. This is the same result that was found by Guilera & Sándor (2017) but these latter authors used the isothermal type I recipes from Tanaka et al. (2002). In the present work, we also numerically corroborate the results found semi-analytically by Morbidelli (2020): the pressure bump also acts as a type I migration trap when adopting recipes derived for nonisothermal disks. Thus, this work can be regarded as a completion of the work of Morbidelli (2020) including disk evolution, dust growth and evolution, planetesimal formation by streaming instability, and calculation of the formation of a giant planet by the hybrid accretion of pebbles and planetesimals and the surrounding gas. Therefore, if rings like the ones observed by the DSHARP project could be generated by viscosity transitions in the disk, our new model could allow us to study planet formation in such rings as well. We will focus on this in a future work, and will expand the model to nonisothermal disks.
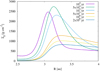 |
Fig. 12 Zoom around the viscosity-transition location of the time evolution of the radial profiles of the gas surface density for fiducial simulation. |
4.4 Pressure bumps as cradles of planet formation
The primary goal of this work is to investigate the whole formation process of only one giant planet at a pressure maximum generated by a viscosity transition at the water ice line. However, if the formed planet can leave the density and pressure maximum quickly, the pressure maximum could still efficiently accumulate the remaining dust drifting inwards, leading to the formation of a second planet. Moreover, if multiple seeds were formed during the streaming instability (e.g., Liu et al. 2019), it would also be important to study in detail which of those are able to grow up to the size of a gas giant.
In addition, there are two important phenomena that could also limit the growth of the planet. The first is the longevity of the pressure maximum, that is, the length of time wherein the conditions are fulfilled to sustain a density and pressure maximum. This will determine whether cores massive enough to form gas giants can be born there, or only lower mass icy/silicate planets with tenuous atmospheres. As an example, Guilera & Sándor (2017) showed that a pressure maximum generated also by a viscosity transition at the outer edge of a dead zone disappears at some point due to the viscous disk evolution. The second phenomenon is the distance between the location of the pressure maximum and the zero torque location in the type I migration regime which, as shown by Guilera & Sándor (2017), is not zero in isothermal disks. If this distance is not small, the accretion of the solid material accumulated at the pressure maximum will not be efficient. This situation could also occur in nonisothermal disks because in general, these locations do not match.
We note that the location of the water ice line may not be the only place where a pressure maximum can develop. Another option could be where, closer to the star, the disk becomes thermally ionized (see Armitage 2013, and references therein). This happens at T ~ 900 K, when alkali metals are partially ionized. At this location, the conductivity of the plasma is also changed, which may result in mismatching accretion rates leading again to the formation of a density and pressure maximum. Accumulation of solid material can be expected here too. However, very close to the central star, where such temperatures can be found, the in situ formation of gas giants can be inhibited because of the small aspect ratio of the disc (Venturini et al. 2020b). This leads mainly to the formation of mini-Neptunes, or at most gas dwarf planets.
Furthermore, it is generally assumed that the ring structures recently observed with ALMA in protoplanetary disks (Andrews et al. 2018)are formed at pressure maxima in gas. A recent study by Dullemond & Penzlin (2018) has revealed by simple linear stability analysis that if dust enhancements are suppressing MRI turbulence, ring-like instabilities develop (we note here that regarding the MRI suppression, very similar physics are at work, as in the case of the water ice line; see more details in Sect. 1). If a dust over-density appears because of a small perturbation, the MRI is reduced in that place leading to higher gas surface density that collects more dust, suppressing the MRI even more. This is a positive feedback mechanism that triggers a density and pressure maximum in gas, which is able to collect dust, favoring planet formation. In addition, MHD simulations also show that multiple pressure maxima associated to instabilities driven by MHD winds can develop along the disk, and that dust can be efficiently accumulated there, forming dusty rings (e.g., Riols & Lesur 2019; Riols et al. 2020).
Finally, a pressure bump appears beyond the orbit of a protoplanet that has reached the pebble isolation mass. This can trigger a chain of planet formation and play an important role in the formation of planetary systems.
If all possible places and mechanisms of density and pressure maxima are able to form planets, a complete planetary system might be born in a single protoplanetary disk. Our approach could be extended to study planet formation in the above-mentioned locations of a protoplanetary disk and this is the goal of future works.
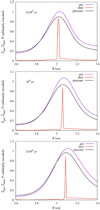 |
Fig. 13 Radial profiles of the gas surface density, dust surface density, and the pressure at three different times until the planet reaches the pebble isolation mass. Gas and pressure maxima move slightly outwards as the disk evolves. The vertical scale of each profile was re-scaled for illustrative purposes as in Morbidelli (2020). |
5 Conclusions
In Guilera & Sándor (2017), we studied the formation of giant planets at pressure maxima generated at the edges of a dead zone due to a viscosity transition. In that work, we considered different homogeneous size populations of planetesimals (of 0.1, 1, 10, and 100 km of radii) and pebbles (of 1 cm radii) along the disk. We found that pressure maxima act as planetesimals and pebble traps and also as a planet migration trap. This situation favored the formation of giant planets at the location of the pressure maxima.
In the present study, we extend our previous one including: a model of dust growth and dust evolution including a back reaction based on the works of Birnstiel et al. (2011, 2012) and Drążkowska et al. (2016); the formation of planetesimals by streaming instability based on the work of Drążkowska et al. (2016), with the corresponding appearance of a lunar-mass embryo by mass conservation; and the growth of the planet by the hybrid accretion of pebbles and planetesimals and the surrounding gas.
With our new model we studied the formation of a giant planet at a pressure maximum generated by a viscosity transition at the water ice line by the hybrid accretion of pebbles and planetesimals. Our main results can be summarized as follows.
-
Dust is very efficiently collected at the pressure maximum, triggering the quick and efficient formation of planetesimals by streaming instability.
-
The planet reaches the pebble-isolation mass within a timescale of only 104 yr, mainly by the accretion of pebbles.
-
The energy released by the accretion of planetesimals delays the onset of the gaseous runaway by at least 1 Myr.
-
The pressure maximum acts as a type I migration trap during most of the planet growth.
A similar model including dust growth, dust evolution, planetesimal formation, and planet formation was recently presented by Voelkel et al. (2020). However, some differences exist between their model and the one presented here: Voelkel et al. (2020) did not include the back reaction to calculate the drift velocities of the dust population; their planetesimal formation model is based on the pebble flux (Lenz et al. 2019) and not on the streaming instability mechanism; and in their model the growth of the planet cores is due only to the accretion of planetesimals. Therefore, to our knowledge this is the first work self-consistently considering, dust growth and evolution, planetesimal formation, and the growth of the planet core by the hybrid accretion of pebbles and planetesimals. We plan to expand our model in future works to study the formation of multi-planetary systems including the full picture of planet formation, beginning from a disk of gas and dust and incorporating the most relevant physical phenomena involved in this process.
Our results also highlight the importance of inhomogeneities in disk properties as catalysts of giant planet formation. The presence of a primordial giant in the disk, or simply its trace towards the central star, could create further inhomogeneities that trigger subsequent dust accumulation and planet formation.
Acknowledgements
The authors thank Joanna Dra̧żkowska for useful discussions about the dust model details. The authors also thank Marc Brouwers, the referee of the work, for his review which helped us to improve and clarify the manuscript. O.M.G. is partially supported by the PICT 2018-0934 from ANPCyT, Argentina. O.M.G. and M3B. are partially supported by the PICT 2016-0053 from ANPCyT, Argentina. O.M.G. acknowledges financial support from ISSI Bern in the framework of the Visiting Scientist Program. O.M.G. and M.P.R. acknowledge financial support from the Iniciativa Científica Milenio (ICM) via the Núcleo Milenio de Formación Planetaria Grant. M.P.R. also acknowledges financial support provided by FONDECYT grant 3190336 and from CONICYT project Basal AFB-170002. Zs.S. thanks the support of the Hungarian National Research, Development and Innovation Office (NKFIH), under the grant K-119993. O.M.G. acknowledges the hosting by IA-PUC as an invited researcher. O.M.G. and J.V. are thankful to discussions held during the ISSI Team “Ice giants: formation, internal structure and link to exoplanets”.
Appendix A Validation of our dust growth, dust evolution, and planetesimal formation model
In order to validate the dust growth and evolution model added in PLANETALP, we tested it against the fiducial case of D16. The model presented in D16 involves a nonisothermal disk with an initial mass of 0.1 M⊙ that evolves viscously and by photoevaporation (Veras & Armitage 2004). The gas disk has an initial shallow surface density corresponding to roughly Σg ∝ r−1, and after 10 Myr the disk has a mass of ~0.02 M⊙. To compare our model with that of D16, we also considered a nonisothermal disk adopting the same physics as in D16. We first computed the vertical structure of the disk using the same disk parameters of their fiducial case. We employed PLANETALP considering that the disk is only heated by viscosity, adopting a constant α-viscosity parameter of 10−3 in all the disk (irradiation due to central star is neglected), and that heat is vertically transported only by radiation, in a similar way to the disk used in D16. In Fig. A.1, we plot the time evolution of the radial profiles of the surface density of gas Σg, the temperature T, and the headwind ηvk. Our profiles and the ones presented in Fig. 2 of D16 look very similar, despite some minor differences (mainly in the ηvk profiles).
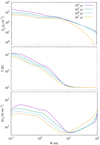 |
Fig. A.1 Time evolution of the radial profiles of the gas surface density (top), temperature (middle), and the headwing ηvk (bottom) fora disk similar to that presented in D16. |
In Fig. A.2, we plot the time evolution of the radial profiles of the dust sizes and Stokes numbers. We note here that as in D16, we consider a threshold fragmentation velocity for the dust of 10 m s−1 along the disk. The solid lines represent the maximum size and Stokes number that the dust distribution reaches. For the case of the dust sizes, the maximum values and the locations of such maxima as the disk evolves are very similar to the ones presented in Fig. 3 in D16. We also show the weighted average of the dust size and the Stokes number (the dashed lines) and the corresponding minimum values (the dashed-dot lines). For the dust size, the minimum value is always 1 μm along the disk. As the dust mass distribution assigns most of the mass to the largest particles, the weighted average of the dust size and the Stokes numbers are close to the maximum values.
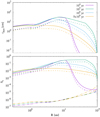 |
Fig. A.2 Time evolution of the radial profiles of the dust size and Stokes number of the dust population. The solid lines represent the maximum values of the dust size and Stokes number. The dashed lines represent the corresponding weighted average of such quantities. The dashed-dot lines correspond to the minimum values of the Stokes numbers corresponding to the minimum value of the dust size of 1 μm. |
As in Fig. 4 of D16, in Fig. A.3 we present the time evolution of the radial profiles of the dust-to-gas ratio, initializing the dust-to-gas ratio equal to 0.01 between 0.3 and 100 au. As time progresses, the dust accumulates in the inner part of the disk. This happens because the rise in the dust-to-gas ratio decreases the dust-drift velocity. Although our radial profile at 3 × 10⁵ yr is very similar to the one presented in Fig. 4 of D16, the profile at 106 yr is quite different. Our profile at 5 × 10⁵ yr is very similar to the one ofD16 at 106 yr. We attribute this discrepancy to the fact that the initial conditions are not exactly the same for both models (the exact initial gas surface density profile is not specified in D16), and that the dust pile-up is strongly dependent on the temperature profiles (Joanna Dra̧żkowska, priv. comm. and also noted by Birnstiel et al. 2012). Despite these differences, the time evolution of the radial profiles is qualitatively similar and present the same behavior. Moreover, the dust pile-up in the inner region allows the formation ofplanetesimals in the same region as in D16.
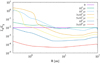 |
Fig. A.3 Time evolution of the radial profiles of the dust-to-gas ratio. As in D16, the initial dust-to-gas ratio is set to 0.01 between 0.3 and 100 au. |
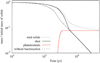 |
Fig. A.4 Time evolution of the total mass of solids (gray line), the mass of dust (black line), and the mass of planetesimals (red line), each normalized to the initial mass of solid in the disk. The black dashed line represents the case where the back reaction is not considered. In this case, the dust pile-up in the inner region of the disk is less significant (due to the fact that dust drift velocities are higher) and the condition for planetesimal formation is not fulfilled. Thus, the dust mass represents the total mass. |
Finally, in Fig. A.4 we plot the time evolution of the total mass of solids, the dust mass, and the planetesimal mass. As in Fig. 5 of D16, if the back-reaction is not considered, the retention of dust is less efficient because drift velocities are higher. In contrast to D16, in our simulation only ~ 8% (~ 24 M⊕) of the initial mass of solids is transformed into planetesimals. Again, despite the differences, the figures are qualitatively very similar and present the same behavior.
Appendix B Different gas-accretion models
The pioneering work of Ikoma et al. (2000) showed that if the solid accretion rate is halted at some point during the formation of the planet, gas accretion timescales become shorter than 2.7 × 10⁵ yr for cores above 10 M⊕. These latterauthors also calculated a semi-analytical prescription for gas accretion after solid accretion rate is halted, given by
 (B.1)
(B.1)
with  being the envelope mass when solid accretion is halted, and
  being given by
 (B.2)
(B.2)
In this last expression, κgr represents the grain opacity, and in order to fit their numerical results Ikoma et al. (2000) estimated that κgr is given by (see Venturini et al. 2020b)
![Mathematical equation: \begin{eqnarray*} \kappa_{\text{gr}}\,{=}\,\begin{cases} 0.22 \, f_{\text{gr}}~\text{cm}^2\text{g}^{-1} & \text{ if $170~\text{K} < {T}_{\text{sup}} < 1600~\text{K}$}, \\[6pt] 1 \, f_{\text{gr}}~\text{cm}^2\text{g}^{-1} & \text{ if ${T}_{\text{sup}} \le 170~\text{K}$}, \end{cases}\end{eqnarray*}](/articles/aa/full_html/2020/10/aa38458-20/aa38458-20-eq65.png) (B.3)
(B.3)
with Tsup being the boundary temperature at the top of the envelope and fgr a reduction factor in the grain opacities with respect to the values corresponding to the ISM. Despite the fact that several works propose a reduction of the grain opacity in the planet envelope due to grain growth and settling (e.g., Movshovitz & Podolak 2008; Mordasini 2004; Ormel 2014), as in our model we use the grain opacities from Pollack et al. (1985), which are representative for the ISM values, we set fgr = 1, not considering a reduction in the grain opacities. In addition, as in the fiducial simulations, the planet location always remains beyond the ice line where Tsup < 170 K, and we adopt κgr = 1. We note that a well-known result is that as the grain opacities are reduced, the gas accretion onto the planet becomes more efficient (e.g., Hubickyj et al. 2005). Thus, a reduction in the grain opacities will reduce the formation timescales of the giant planets2.
Therefore, in order to compare the gas accretion by the planet, we compute a new set of simulations incorporating the gas accretion recipes from Ikoma et al. (2000). We compute the planet growth using our fiducial model until the planet reaches the pebble isolation mass and then we compute the gas accretion following the prescriptions from Ikoma et al. (2000). We perform two new simulations. In the first one, the accretion of solids is halted after the planet reaches the pebble isolation mass. For this case, we use Eq. (B.1), to compute the gas accretion by the planet after that time. In the second one, we consider the accretion of planetesimals after the planet reaches the pebble isolation mass. Ikoma et al. (2000) also showed that if the solid accretion rate is taken with a constant value of 10−6 M⊕ yr−1, the corresponding gas accretion timescale,  , is about six times the gas accretion timescale
  . Therefore, for simplicity, and despite the fact that the planetesimal accretion rate is not constant and is in general greater than 10−6 M⊕ yr−1, we adopt
  to compute Eq. (B.1) for this second simulation.
In Fig. B.1, we plot the time evolution of the core mass and envelope mass comparing our fiducial simulations to the cases where gas accretion is computed following Ikoma et al. (2000) after the planet reaches the pebble isolation mass. As in Fig. 6, the black and red curves represent the core mass and the envelope mass for the fiducial simulations, respectively.The purple and green lines represent the core mass and the envelope mass for the cases where we considered the gas accretion given by Ikoma et al. (2000), respectively. In both sets of simulations, the dashed lines represent the case where solid accretion is halted after the planet reaches the pebble isolation mass, while the solid lines represent the case where planetesimal accretion is considered after that time. For the first case, we can see that the cross-over mass is reached at ~ 5 × 10⁵ yr (the dashedgreen line). We find that using our full model (the red dashed line), the planet accretes gasmore efficiently and the runaway gas accretion phase is triggered slightly earlier, at ~ 1.5 × 10⁵ yr. Still, the difference in the crossover time between the two approaches differs only by a factor of approximately three. We find the same behavior when planetesimal accretion is considered after the planet reaches the pebble isolation mass. In this case, we find that with our model the planet reaches the cross-over mass at ~ 9 × 10⁵ yr (the red solid line), while when employing the gas accretion recipes from Ikoma et al. (2000) the cross-over mass is reached at ~ 2.7 × 10⁶ yr. This also implies an extension of the formation timescale by a factor of about three. Despite this difference, the result of considering the accretion of planetesimals is the same in both scenarios: it prolongs the time taken by the planet to reach the gaseous runaway phase.
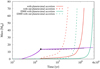 |
Fig. B.1 Time evolution of the mass of the core and the envelope mass of the planet. The solid lines represent the models where the hybrid accretion of pebbles and planetesimals is considered, while dashed lines correspond to the cases where solid accretion is halted after the planet reaches the pebble isolation mass. The black (core) and red (envelope) lines correspond to the model where gas accretion is calculated with our full model (Guilera et al. 2014). The purple (core) and green (envelope) lines represent the models where the gas accretion rates from Ikoma et al. (2000) are used. |
Summarizing, we find that by solving the constitutive envelope equations with our model (Guilera et al. 2010, 2014), the cross-over mass is reached approximately three times earlier with respect to the case where the gas accretion prescription from Ikoma et al. (2000) is used. Despite the fact that the analytical recipes for the gas accretion from Ikoma et al. (2000) reproduce their numerical results, where also a Henyey method was applied to solve the constitutive envelope equations, some differences exist between the two models. While in our model we use the equation of state (EoS) from Saumon et al. (1995), Ikoma et al. (2000) used an ideal gas EoS considering hydrogen molecules and the ionization of hydrogen atoms. Another difference is related to the outer envelope boundary conditions. While in the work of Ikoma et al. (2000) these remain constant in time, in our model they evolve in time. The gas accretion rate is a very important quantity, because it determines the time at which the gaseous runaway phase is triggered. Therefore, a more detailed study of the differences in the results will be done in a future work.
References
- Alibert, Y., Mordasini, C., Benz, W., & Winisdoerffer, C. 2005, A&A, 434, 343 [NASA ADS] [CrossRef] [EDP Sciences] [Google Scholar]
- Alibert, Y., Carron, F., Fortier, A., et al. 2013, A&A, 558, A109 [NASA ADS] [CrossRef] [EDP Sciences] [Google Scholar]
- Alibert, Y., Venturini, J., Helled, R., et al. 2018, Nat. Astron., 2, 873 [NASA ADS] [CrossRef] [Google Scholar]
- Andrews, S. M., Wilner, D. J., Hughes, A. M., Qi, C., & Dullemond, C. P. 2010, ApJ, 723, 1241 [NASA ADS] [CrossRef] [Google Scholar]
- Andrews, S. M., Huang, J., Pérez, L. M., et al. 2018, ApJ, 869, L41 [NASA ADS] [CrossRef] [Google Scholar]
- Armitage, P. J. 2013, Astrophysics of Planet Formation (Cambridge: Cambridge University Press) [Google Scholar]
- Ataiee, S., Baruteau, C., Alibert, Y., & Benz, W. 2018, A&A, 615, A110 [NASA ADS] [CrossRef] [EDP Sciences] [Google Scholar]
- Benítez-Llambay, P., Masset, F., Koenigsberger, G., & Szulágyi, J. 2015, Nature, 520, 63 [NASA ADS] [CrossRef] [Google Scholar]
- Benvenuto, O. G., & Brunini, A. 2005, MNRAS, 356, 1383 [NASA ADS] [CrossRef] [Google Scholar]
- Benz, W., Ida, S., Alibert, Y., Lin, D., & Mordasini, C. 2014, Protostars and Planets VI (Tucson, AZ: University of Arizona Press), 691 [Google Scholar]
- Birnstiel, T., Ormel, C. W., & Dullemond, C. P. 2011, A&A, 525, A11 [NASA ADS] [CrossRef] [EDP Sciences] [Google Scholar]
- Birnstiel, T., Klahr, H., & Ercolano, B. 2012, A&A, 539, A148 [NASA ADS] [CrossRef] [EDP Sciences] [Google Scholar]
- Bitsch, B., Morbidelli, A., Johansen, A., et al. 2018, A&A, 612, A30 [NASA ADS] [CrossRef] [EDP Sciences] [Google Scholar]
- Blum, J., & Wurm, G. 2008, ARA&A, 46, 21 [Google Scholar]
- Bodenheimer, P., & Pollack, J. B. 1986, Icarus, 67, 391 [NASA ADS] [CrossRef] [Google Scholar]
- Bodenheimer, P., Stevenson, D. J., Lissauer, J. J., & D’Angelo, G. 2018, ApJ, 868, 138 [NASA ADS] [CrossRef] [Google Scholar]
- Boss, A. P. 1997, Science, 276, 1836 [NASA ADS] [CrossRef] [Google Scholar]
- Brauer, F., Henning, T., & Dullemond, C. P. 2008, A&A, 487, L1 [NASA ADS] [CrossRef] [EDP Sciences] [Google Scholar]
- Brouwers, M. G., & Ormel, C. W. 2020, A&A, 634, A15 [Google Scholar]
- Brouwers, M. G., Vazan, A., & Ormel, C. W. 2018, A&A, 611, A65 [NASA ADS] [CrossRef] [EDP Sciences] [Google Scholar]
- Crida, A., Morbidelli, A., & Masset, F. 2006, Icarus, 181, 587 [Google Scholar]
- Dipierro, G., Laibe, G., Alexander, R., & Hutchison, M. 2018, MNRAS, 479, 4187 [NASA ADS] [CrossRef] [Google Scholar]
- Drążkowska, J., & Alibert, Y. 2017, A&A, 608, A92 [NASA ADS] [CrossRef] [EDP Sciences] [Google Scholar]
- Drążkowska, J., & Dullemond, C. P. 2014, A&A, 572, A78 [NASA ADS] [CrossRef] [EDP Sciences] [Google Scholar]
- Drążkowska, J., Alibert, Y., & Moore, B. 2016, A&A, 594, A105 [NASA ADS] [CrossRef] [EDP Sciences] [Google Scholar]
- Dullemond, C. P., & Penzlin, A. B. T. 2018, A&A, 609, A50 [NASA ADS] [CrossRef] [EDP Sciences] [Google Scholar]
- Dullemond, C. P., Birnstiel, T., Huang, J., et al. 2018, ApJ, 869, L46 [NASA ADS] [CrossRef] [EDP Sciences] [Google Scholar]
- Dzyurkevich, N., Turner, N. J., Henning, T., & Kley, W. 2013, ApJ, 765, 114 [NASA ADS] [CrossRef] [Google Scholar]
- Ercolano, B., Jennings, J., Rosotti, G., & Birnstiel, T. 2017, MNRAS, 472, 4117 [NASA ADS] [CrossRef] [Google Scholar]
- Fortier, A., Benvenuto, O. G., & Brunini, A. 2007, A&A, 473, 311 [NASA ADS] [CrossRef] [EDP Sciences] [Google Scholar]
- Fortier, A., Benvenuto, O. G., & Brunini, A. 2009, A&A, 500, 1249 [NASA ADS] [CrossRef] [EDP Sciences] [Google Scholar]
- Gárate, M., Birnstiel, T., Drążkowska, J., & Stammler, S. M. 2020, A&A, 635, A149 [NASA ADS] [CrossRef] [EDP Sciences] [Google Scholar]
- Guilera, O. M., & Sándor, Z. 2017, A&A, 604, A10 [NASA ADS] [CrossRef] [EDP Sciences] [Google Scholar]
- Guilera, O. M., Brunini, A., & Benvenuto, O. G. 2010, A&A, 521, A50 [NASA ADS] [CrossRef] [EDP Sciences] [Google Scholar]
- Guilera, O. M., de Elía, G. C., Brunini, A., & Santamaría, P. J. 2014, A&A, 565, A96 [NASA ADS] [CrossRef] [EDP Sciences] [Google Scholar]
- Guilera, O. M., Cuello, N., Montesinos, M., et al. 2019, MNRAS, 486, 5690 [NASA ADS] [CrossRef] [Google Scholar]
- Hayashi, C. 1981, Prog. Theor. Phys. Suppl., 70, 35 [NASA ADS] [CrossRef] [MathSciNet] [Google Scholar]
- Hubickyj, O., Bodenheimer, P., & Lissauer, J. J. 2005, Icarus, 179, 415 [NASA ADS] [CrossRef] [Google Scholar]
- Ida, S., & Lin, D. N. C. 2008, ApJ, 673, 487 [NASA ADS] [CrossRef] [Google Scholar]
- Ikoma, M., Nakazawa, K., & Emori, H. 2000, ApJ, 537, 1013 [NASA ADS] [CrossRef] [Google Scholar]
- Ilgner, M., & Nelson, R. P. 2006, A&A, 445, 205 [NASA ADS] [CrossRef] [EDP Sciences] [Google Scholar]
- Inaba, S., & Ikoma, M. 2003, A&A, 410, 711 [NASA ADS] [CrossRef] [EDP Sciences] [Google Scholar]
- Inaba, S., Tanaka, H., Nakazawa, K., Wetherill, G. W., & Kokubo, E. 2001, Icarus, 149, 235 [NASA ADS] [CrossRef] [Google Scholar]
- Jiménez, M. A., & Masset, F. S. 2017, MNRAS, 471, 4917 [NASA ADS] [CrossRef] [Google Scholar]
- Johansen, A., & Lambrechts, M. 2017, Ann. Rev. Earth Planet. Sci., 45, 359 [NASA ADS] [CrossRef] [Google Scholar]
- Johansen, A., Oishi, J. S., Mac Low, M.-M., et al. 2007, Nature, 448, 1022 [Google Scholar]
- Johansen, A., Youdin, A., & Mac Low, M.-M. 2009, ApJ, 704, L75 [NASA ADS] [CrossRef] [Google Scholar]
- Kretke, K. A., & Lin, D. N. C. 2007, ApJ, 664, L55 [NASA ADS] [CrossRef] [Google Scholar]
- Kruijer, T. S., Burkhardt, C., Budde, G., & Kleine, T. 2017, Proc. Natl. Acad. Sci., 114, 6712 [Google Scholar]
- Lambrechts, M., & Johansen, A. 2012, A&A, 544, A32 [Google Scholar]
- Lambrechts, M., Johansen, A., & Morbidelli, A. 2014, A&A, 572, A35 [NASA ADS] [CrossRef] [EDP Sciences] [Google Scholar]
- Lambrechts, M., Morbidelli, A., Jacobson, S. A., et al. 2019, A&A, 627, A83 [NASA ADS] [CrossRef] [EDP Sciences] [Google Scholar]
- Lenz, C. T., Klahr, H., & Birnstiel, T. 2019, ApJ, 874, 36 [CrossRef] [Google Scholar]
- Liu, B., Ormel, C. W., & Johansen, A. 2019, A&A, 624, A114 [NASA ADS] [CrossRef] [EDP Sciences] [Google Scholar]
- Lodders, K. 2003, ApJ, 591, 1220 [NASA ADS] [CrossRef] [Google Scholar]
- Lyra, W., Johansen, A., Klahr, H., & Piskunov, N. 2008, A&A, 491, L41 [NASA ADS] [CrossRef] [EDP Sciences] [Google Scholar]
- Lyra, W., Johansen, A., Zsom, A., Klahr, H., & Piskunov, N. 2009, A&A, 497, 869 [NASA ADS] [CrossRef] [EDP Sciences] [Google Scholar]
- Lyra, W., Turner, N. J., & McNally, C. P. 2015, A&A, 574, A10 [NASA ADS] [CrossRef] [EDP Sciences] [Google Scholar]
- Masset, F. S. 2017, MNRAS, 472, 4204 [NASA ADS] [CrossRef] [Google Scholar]
- Matsumura, S., Pudritz, R. E., & Thommes, E. W. 2009, ApJ, 691, 1764 [NASA ADS] [CrossRef] [Google Scholar]
- Mayor, M., & Queloz, D. 1995, Nature, 378, 355 [Google Scholar]
- Miguel, Y., Guilera, O. M., & Brunini, A. 2011, MNRAS, 412, 2113 [NASA ADS] [CrossRef] [Google Scholar]
- Mizuno, H. 1980, Prog. Theor. Phys., 64, 544 [Google Scholar]
- Morbidelli, A. 2020, A&A, 638, A1 [Google Scholar]
- Mordasini, C. 2004, Diplomarbeit, Unversität Bern, Switzerland [Google Scholar]
- Mordasini, C. 2018, Handbook of Exoplanets (Cham: Springer), 143 [Google Scholar]
- Movshovitz, N., & Podolak, M. 2008, Icarus, 194, 368 [NASA ADS] [CrossRef] [Google Scholar]
- Ndugu, N., Bitsch, B., & Jurua, E. 2018, MNRAS, 474, 886 [Google Scholar]
- Ogihara, M., Kokubo, E., Suzuki, T. K., & Morbidelli, A. 2018, A&A, 615, A63 [NASA ADS] [CrossRef] [EDP Sciences] [Google Scholar]
- Okuzumi, S. 2009, ApJ, 698, 1122 [NASA ADS] [CrossRef] [Google Scholar]
- Ormel, C. W. 2014, ApJ, 789, L18 [NASA ADS] [CrossRef] [Google Scholar]
- Ormel, C. W., & Klahr, H. H. 2010, A&A, 520, A43 [NASA ADS] [CrossRef] [EDP Sciences] [Google Scholar]
- Ormel, C. W., & Kobayashi, H. 2012, ApJ, 747, 115 [NASA ADS] [CrossRef] [Google Scholar]
- Paardekooper,S.-J., Baruteau, C., & Kley, W. 2011, MNRAS, 410, 293 [NASA ADS] [CrossRef] [Google Scholar]
- Pinilla, P., Flock, M., Ovelar, M. d. J., & Birnstiel, T. 2016, A&A, 596, A81 [NASA ADS] [CrossRef] [EDP Sciences] [Google Scholar]
- Pollack, J. B., McKay, C. P., & Christofferson, B. M. 1985, Icarus, 64, 471 [NASA ADS] [CrossRef] [Google Scholar]
- Pollack, J. B., Hubickyj, O., Bodenheimer, P., et al. 1996, Icarus, 124, 62 [NASA ADS] [CrossRef] [Google Scholar]
- Pringle, J. E. 1981, ARA&A, 19, 137 [NASA ADS] [CrossRef] [Google Scholar]
- Regály, Z., Sándor, Z., Csomós, P., & Ataiee, S. 2013, MNRAS, 433, 2626 [NASA ADS] [CrossRef] [Google Scholar]
- Riols, A., & Lesur, G. 2019, A&A, 625, A108 [NASA ADS] [CrossRef] [EDP Sciences] [Google Scholar]
- Riols, A., Lesur, G., & Menard, F. 2020, A&A, 639, A95 [CrossRef] [EDP Sciences] [Google Scholar]
- Ronco, M. P., Guilera, O. M., & de Elía, G. C. 2017, MNRAS, 471, 2753 [NASA ADS] [CrossRef] [Google Scholar]
- Safronov, V. S. 1969, Evoliutsiia doplanetnogo oblaka [Google Scholar]
- Sándor, Z., Lyra, W., & Dullemond, C. P. 2011, ApJ, 728, L9 [NASA ADS] [CrossRef] [Google Scholar]
- Sano, T., Miyama, S. M., Umebayashi, T., & Nakano, T. 2000, ApJ, 543, 486 [NASA ADS] [CrossRef] [Google Scholar]
- San Sebastián, I. L., Guilera, O. M., & Parisi, M. G. 2019, A&A, 625, A138 [NASA ADS] [CrossRef] [EDP Sciences] [Google Scholar]
- Saumon, D., Chabrier, G., & van Horn, H. M. 1995, ApJS, 99, 713 [NASA ADS] [CrossRef] [Google Scholar]
- Tanaka, H., Takeuchi, T., & Ward, W. R. 2002, ApJ, 565, 1257 [NASA ADS] [CrossRef] [Google Scholar]
- Venturini, J., & Helled, R. 2020, A&A, 634, A31 [NASA ADS] [CrossRef] [EDP Sciences] [Google Scholar]
- Venturini, J., Alibert, Y., Benz, W., & Ikoma, M. 2015, A&A, 576, A114 [NASA ADS] [CrossRef] [EDP Sciences] [Google Scholar]
- Venturini, J., Alibert, Y., & Benz, W. 2016, A&A, 596, A90 [NASA ADS] [CrossRef] [EDP Sciences] [Google Scholar]
- Venturini, J., Ronco, M. P., & Guilera, O. M. 2020a, Space Sci. Rev., 216, 86 [CrossRef] [Google Scholar]
- Venturini, J., Guilera, O. M., Ronco, M. P., & Mordasini, C. 2020b, A&A, submitted [arXiv:2008.05497] [Google Scholar]
- Veras, D., & Armitage, P. J. 2004, MNRAS, 347, 613 [NASA ADS] [CrossRef] [Google Scholar]
- Voelkel, O., Klahr, H., Mordasini, C., Emsenhuber, A., & Lenz, C. 2020, A&A, 642, A75 [NASA ADS] [CrossRef] [EDP Sciences] [Google Scholar]
- Wahl, S. M., Hubbard, W. B., Militzer, B., et al. 2017, Geophys. Res. Lett., 44, 4649 [NASA ADS] [CrossRef] [Google Scholar]
- Yang, C.-C., Mac Low, M.-M., & Johansen, A. 2018, ApJ, 868, 27 [NASA ADS] [CrossRef] [Google Scholar]
- Youdin, A. N., & Goodman, J. 2005, ApJ, 620, 459 [NASA ADS] [CrossRef] [Google Scholar]
- Youdin, A. N., & Lithwick, Y. 2007, Icarus, 192, 588 [NASA ADS] [CrossRef] [Google Scholar]
- Youdin, A. N., & Shu, F. H. 2002, ApJ, 580, 494 [NASA ADS] [CrossRef] [Google Scholar]
We note that there is a typo in the signs of Eqs. (A.4) and (A.5) of D16. If the headwind ηvk is defined as in our Eq. (17), the correct signs are the ones shown for A and B in our Eqs. (18) (see Dipierro et al. 2018; Gárate et al. 2020).
As an example, in San Sebastián et al. (2019) we showed that the formation time of a giant planet growing at 5 au in a disk ten times more massive than the MMSN (Minimum Mass Solar Nebula, Hayashi 1981) by the accretion of 100 km planetesimals is reduced by about 45% if the grain opacities are reduced by a factor 50 in our model (see Fig. A.1 of such work).
All Figures
|
Fig. 1 Viscous evolution of the gas surface density radial profiles during the first 0.5 Myr. |
| In the text | |
|
Fig. 2 Time evolution of the radial profiles of the surface density of dust (panel a) and planetesimals (panel b). Planetesimals are only formed near the pressure maximum location. This simulation corresponds to the case of the disk evolution without planet formation. |
| In the text | |
|
Fig. 3 Time evolution of the total mass of solids, dust, and planetesimals. In just 5 × 10⁵ yr almost all of the dust has been removed from the disk. The simulation corresponds to the case of the disk evolution without planet formation. |
| In the text | |
|
Fig. 4 Time evolution of the radial profiles of the maximum sizes that the dust can reach. The maximum sizes for the dust population are reached at the pressure maximum location. The simulation corresponds to the case of the disk evolution without planet formation. |
| In the text | |
|
Fig. 5 Time evolution of the radial profiles of the mass weighted mean Stokes number of the dust size distribution. As for the dust sizes, the maximum values are reached at the pressure maximum location. The simulation corresponds to the case of the disk evolution without planet formation. |
| In the text | |
|
Fig. 6 Time evolution of the mass of the core (the black lines) and the envelope mass of the planet (the red lines). The solid lines represent the model where the hybrid accretion of pebbles and planetesimals is considered. The dashed lines correspond to the case where the accretion of planetesimals after the planet reaches the pebble isolation mass (black filled dot) is neglected. |
| In the text | |
|
Fig. 7 Time evolution of the solid accretion rate for the simulation where the hybrid accretion of pebbles and planetesimals is considered. The black filled square corresponds to the time at which the embryo is introduced in the simulation. Initially, the total solid accretion rate is dominated by the accretion of pebbles (the solid red line). After the planet reaches the pebble isolation mass (black filled dot), the accretion rate decays significantly and is only due to the accretion of planetesimals (the dashed red line). |
| In the text | |
|
Fig. 8 Time evolution of the semi-major axis of the planet for the simulations corresponding to the case where the hybrid accretion of pebbles and planetesimals is considered. The black line corresponds to the fiducial simulation where type I migration recipes from Tanaka et al. (2002, T02) are adopted. The purple and green lines correspond to the cases where type I migration recipes from Paardekooper et al. (2011, P11) and Jiménez & Masset (2017, JM17) are considered, respectively.For the cases T02 and JM17, the planet remains in a migration trap until it opens a gap in the gas disk. The red line represents the values of the critical thermal mass associated to the thermal torque (for the T02 case). As this mass is always much lower than the mass of the planet, the thermal torque does not have any effect on the torque over the planet. |
| In the text | |
|
Fig. 9 Planet formation tracks for the simulations using the type I migration recipes from Paardekooper et al. (2011, P11) and Jiménez & Masset (2017, JM17). |
| In the text | |
|
Fig. 10 Time evolution of the mass of the core and the envelope mass of the planet considering the pebble isolation masses given by Ataiee et al. (2018), compared to the fiducial case where we adopt the pebble isolation masses from Lambrechts et al. (2014).
|
| In the text | |
|
Fig. 11 Time evolution of the mass of the core (the black lines) and the envelope (the red lines) of the planet for the fiducial simulation (the solid lines) and the case where the planet is allowed to accrete the pebbles at its co-orbital region after it has reached the pebble isolation mass (the dashed lines). |
| In the text | |
|
Fig. 12 Zoom around the viscosity-transition location of the time evolution of the radial profiles of the gas surface density for fiducial simulation. |
| In the text | |
|
Fig. 13 Radial profiles of the gas surface density, dust surface density, and the pressure at three different times until the planet reaches the pebble isolation mass. Gas and pressure maxima move slightly outwards as the disk evolves. The vertical scale of each profile was re-scaled for illustrative purposes as in Morbidelli (2020). |
| In the text | |
|
Fig. A.1 Time evolution of the radial profiles of the gas surface density (top), temperature (middle), and the headwing ηvk (bottom) fora disk similar to that presented in D16. |
| In the text | |
|
Fig. A.2 Time evolution of the radial profiles of the dust size and Stokes number of the dust population. The solid lines represent the maximum values of the dust size and Stokes number. The dashed lines represent the corresponding weighted average of such quantities. The dashed-dot lines correspond to the minimum values of the Stokes numbers corresponding to the minimum value of the dust size of 1 μm. |
| In the text | |
|
Fig. A.3 Time evolution of the radial profiles of the dust-to-gas ratio. As in D16, the initial dust-to-gas ratio is set to 0.01 between 0.3 and 100 au. |
| In the text | |
|
Fig. A.4 Time evolution of the total mass of solids (gray line), the mass of dust (black line), and the mass of planetesimals (red line), each normalized to the initial mass of solid in the disk. The black dashed line represents the case where the back reaction is not considered. In this case, the dust pile-up in the inner region of the disk is less significant (due to the fact that dust drift velocities are higher) and the condition for planetesimal formation is not fulfilled. Thus, the dust mass represents the total mass. |
| In the text | |
|
Fig. B.1 Time evolution of the mass of the core and the envelope mass of the planet. The solid lines represent the models where the hybrid accretion of pebbles and planetesimals is considered, while dashed lines correspond to the cases where solid accretion is halted after the planet reaches the pebble isolation mass. The black (core) and red (envelope) lines correspond to the model where gas accretion is calculated with our full model (Guilera et al. 2014). The purple (core) and green (envelope) lines represent the models where the gas accretion rates from Ikoma et al. (2000) are used. |
| In the text | |
Current usage metrics show cumulative count of Article Views (full-text article views including HTML views, PDF and ePub downloads, according to the available data) and Abstracts Views on Vision4Press platform.
Data correspond to usage on the plateform after 2015. The current usage metrics is available 48-96 hours after online publication and is updated daily on week days.
Initial download of the metrics may take a while.