Fig. B.1
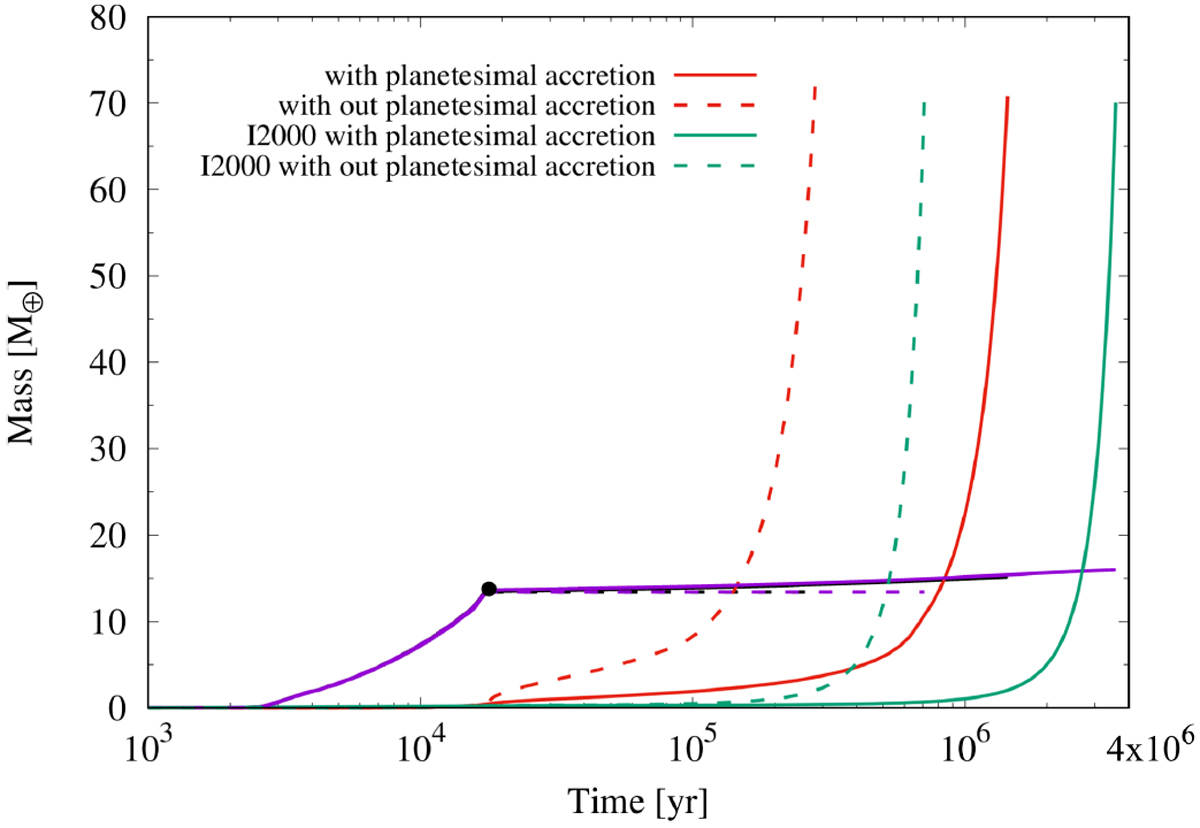
Time evolution of the mass of the core and the envelope mass of the planet. The solid lines represent the models where the hybrid accretion of pebbles and planetesimals is considered, while dashed lines correspond to the cases where solid accretion is halted after the planet reaches the pebble isolation mass. The black (core) and red (envelope) lines correspond to the model where gas accretion is calculated with our full model (Guilera et al. 2014). The purple (core) and green (envelope) lines represent the models where the gas accretion rates from Ikoma et al. (2000) are used.
Current usage metrics show cumulative count of Article Views (full-text article views including HTML views, PDF and ePub downloads, according to the available data) and Abstracts Views on Vision4Press platform.
Data correspond to usage on the plateform after 2015. The current usage metrics is available 48-96 hours after online publication and is updated daily on week days.
Initial download of the metrics may take a while.