Fig. 7
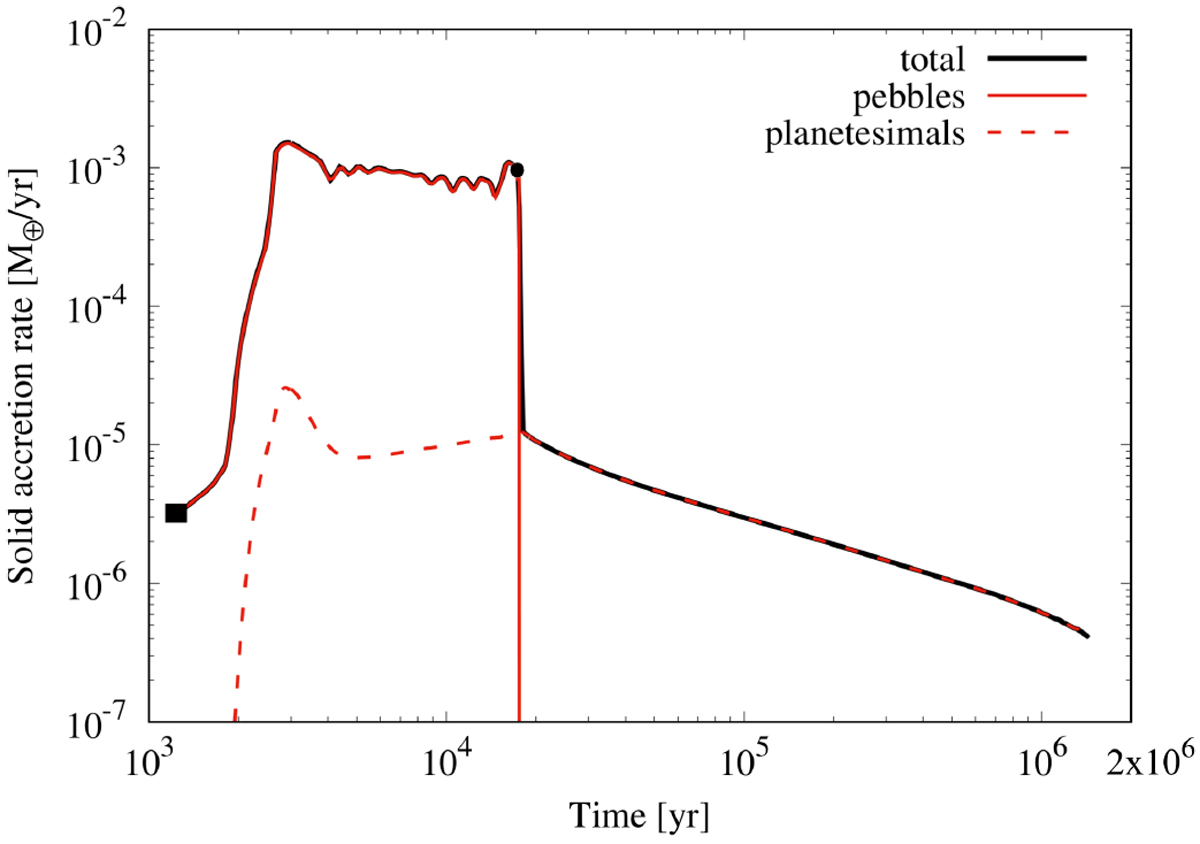
Time evolution of the solid accretion rate for the simulation where the hybrid accretion of pebbles and planetesimals is considered. The black filled square corresponds to the time at which the embryo is introduced in the simulation. Initially, the total solid accretion rate is dominated by the accretion of pebbles (the solid red line). After the planet reaches the pebble isolation mass (black filled dot), the accretion rate decays significantly and is only due to the accretion of planetesimals (the dashed red line).
Current usage metrics show cumulative count of Article Views (full-text article views including HTML views, PDF and ePub downloads, according to the available data) and Abstracts Views on Vision4Press platform.
Data correspond to usage on the plateform after 2015. The current usage metrics is available 48-96 hours after online publication and is updated daily on week days.
Initial download of the metrics may take a while.