Fig. A.2
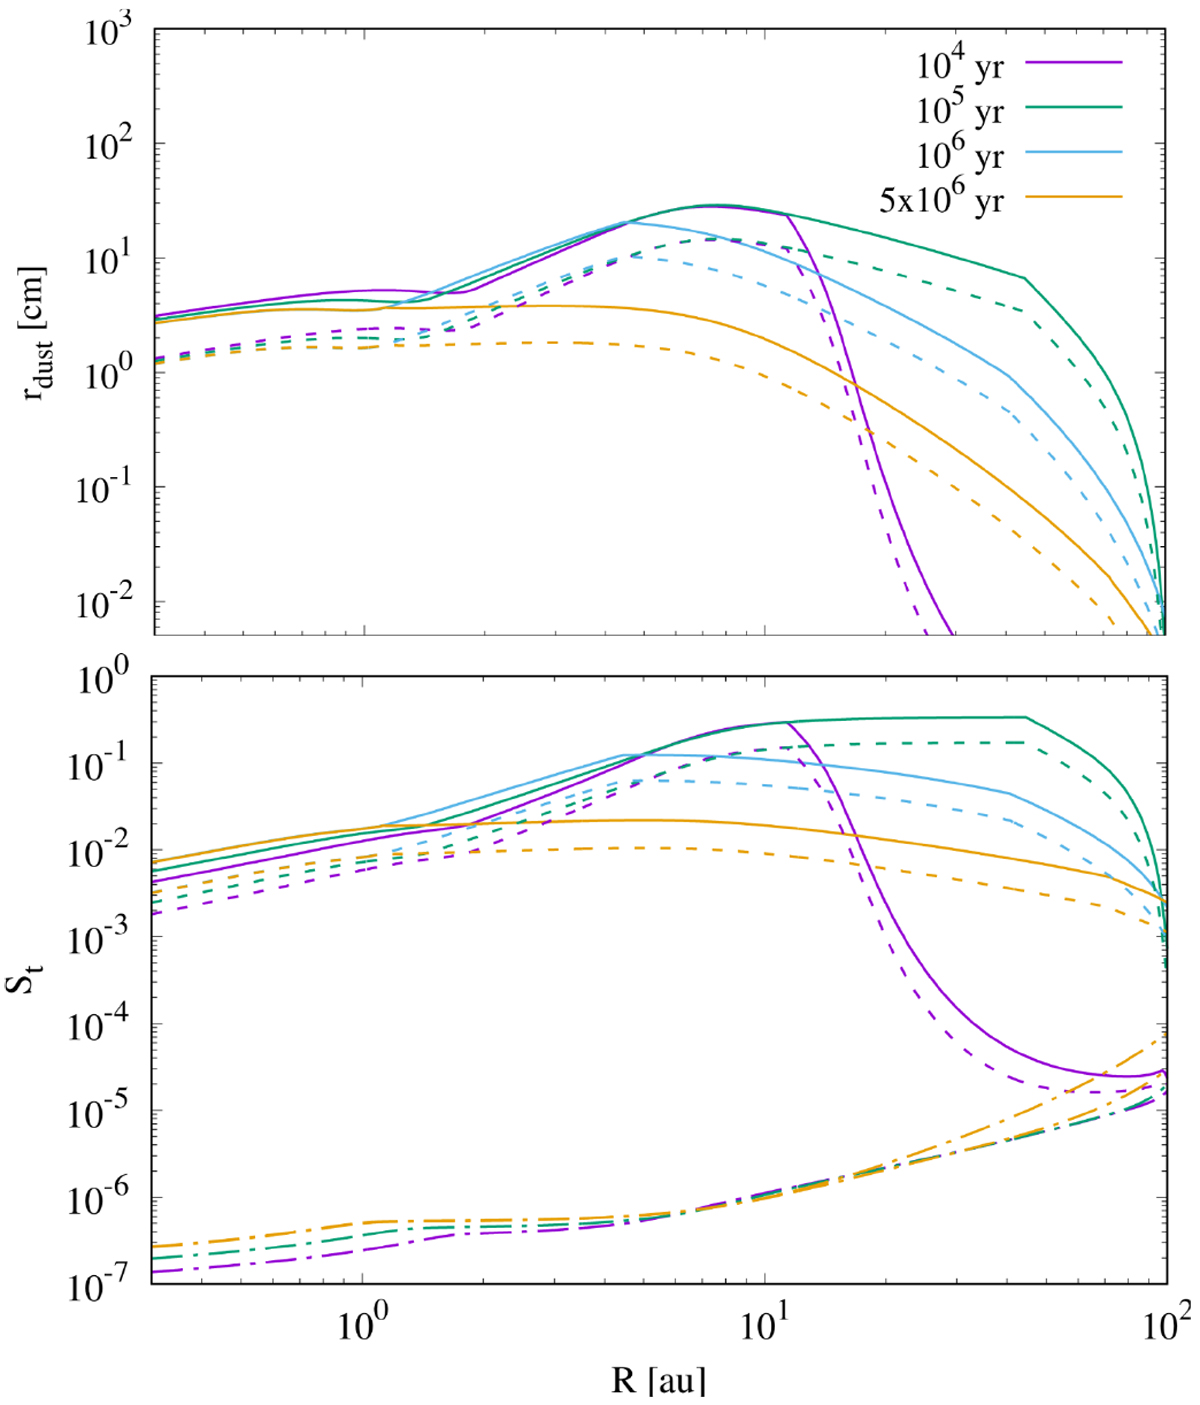
Time evolution of the radial profiles of the dust size and Stokes number of the dust population. The solid lines represent the maximum values of the dust size and Stokes number. The dashed lines represent the corresponding weighted average of such quantities. The dashed-dot lines correspond to the minimum values of the Stokes numbers corresponding to the minimum value of the dust size of 1 μm.
Current usage metrics show cumulative count of Article Views (full-text article views including HTML views, PDF and ePub downloads, according to the available data) and Abstracts Views on Vision4Press platform.
Data correspond to usage on the plateform after 2015. The current usage metrics is available 48-96 hours after online publication and is updated daily on week days.
Initial download of the metrics may take a while.